Intertek Results Presentation Deck
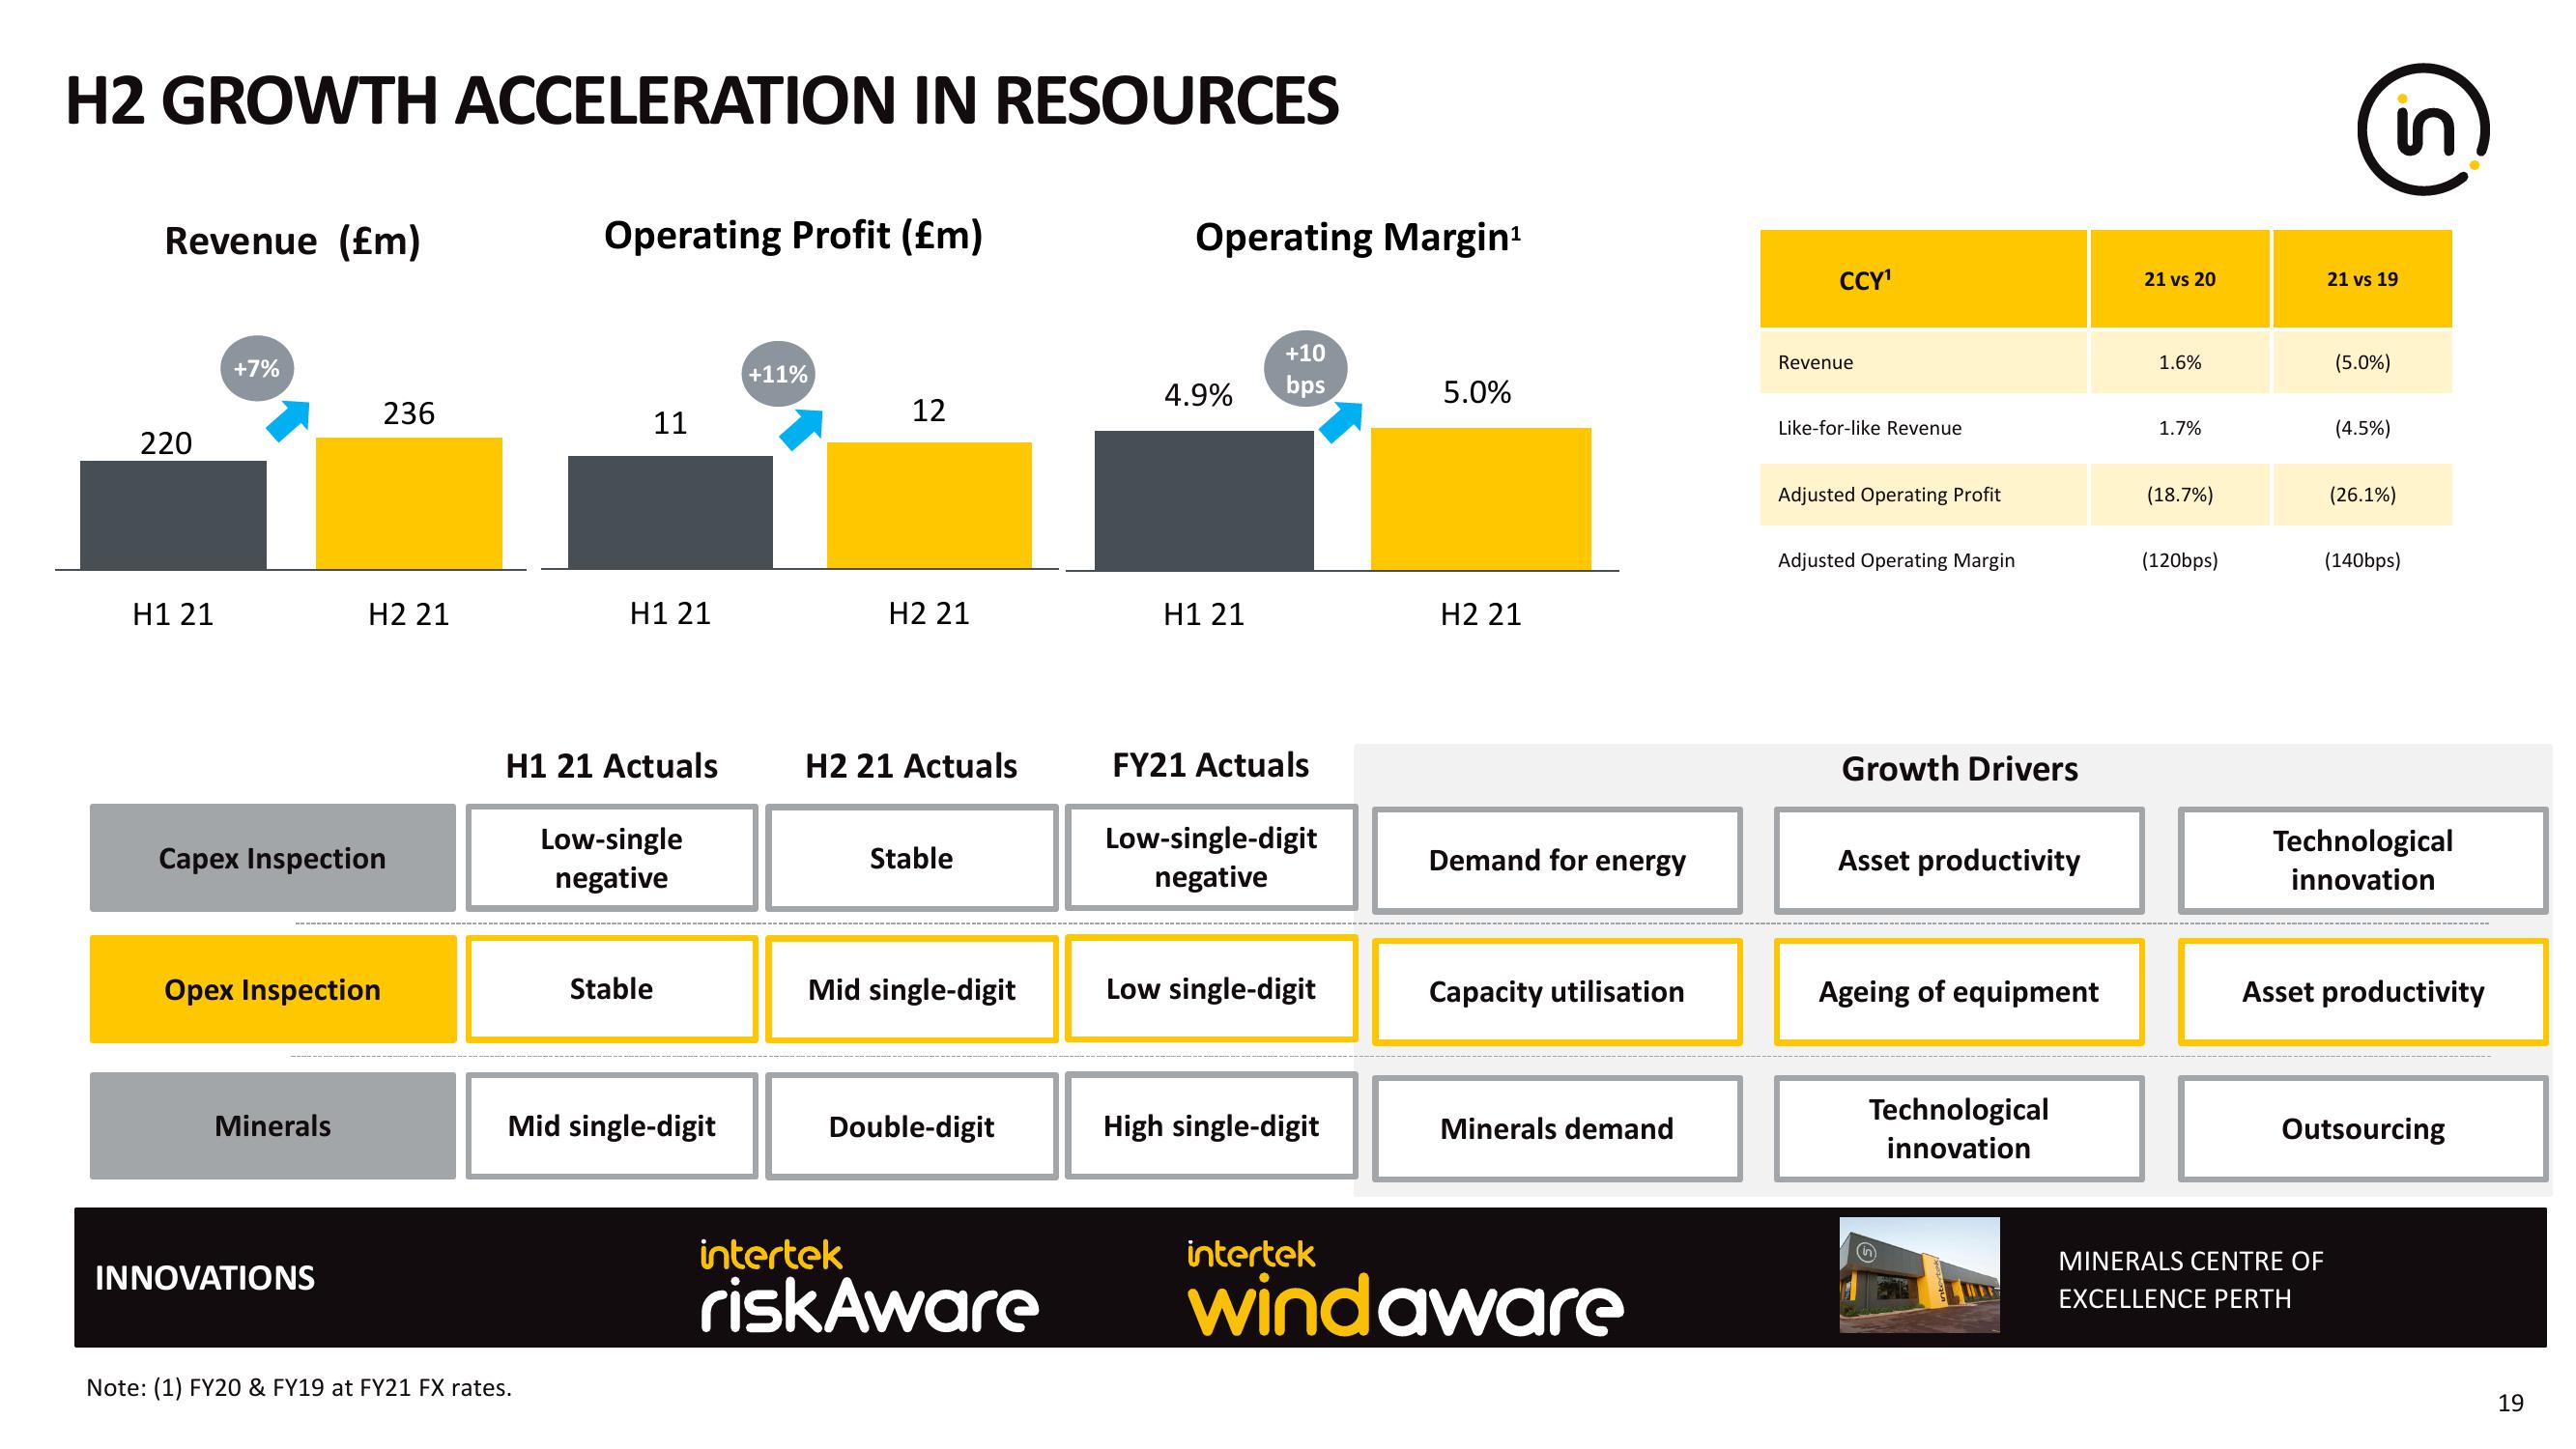
H2 GROWTH ACCELERATION IN RESOURCES
Revenue (Em)
220
H1 21
+7%
Capex Inspection
Opex Inspection
Minerals
236
H2 21
INNOVATIONS
Operating Profit (£m)
Note: (1) FY20 & FY19 at FY21 FX rates.
11
H1 21
H1 21 Actuals
Low-single
negative
Stable
Mid single-digit
+11%
12
H2 21
H2 21 Actuals
Stable
Mid single-digit
Double-digit
intertek
risk Aware
Operating Margin¹
4.9%
H1 21
+10
bps
FY21 Actuals
Low-single-digit
negative
Low single-digit
High single-digit
5.0%
H2 21
Demand for energy
Capacity utilisation
Minerals demand
intertek
wind aware
CCY¹
Revenue
Like-for-like Revenue
Adjusted Operating Profit
Adjusted Operating Margin
Growth Drivers
Asset productivity
Ageing of equipment
Technological
innovation
21 vs 20
1.6%
1.7%
(18.7%)
(120bps)
in
21 vs 19
(5.0%)
MINERALS CENTRE OF
EXCELLENCE PERTH
S
(4.5%)
(26.1%)
(140bps)
Technological
innovation
Asset productivity
Outsourcing
19View entire presentation