monday.com Investor Day Presentation Deck
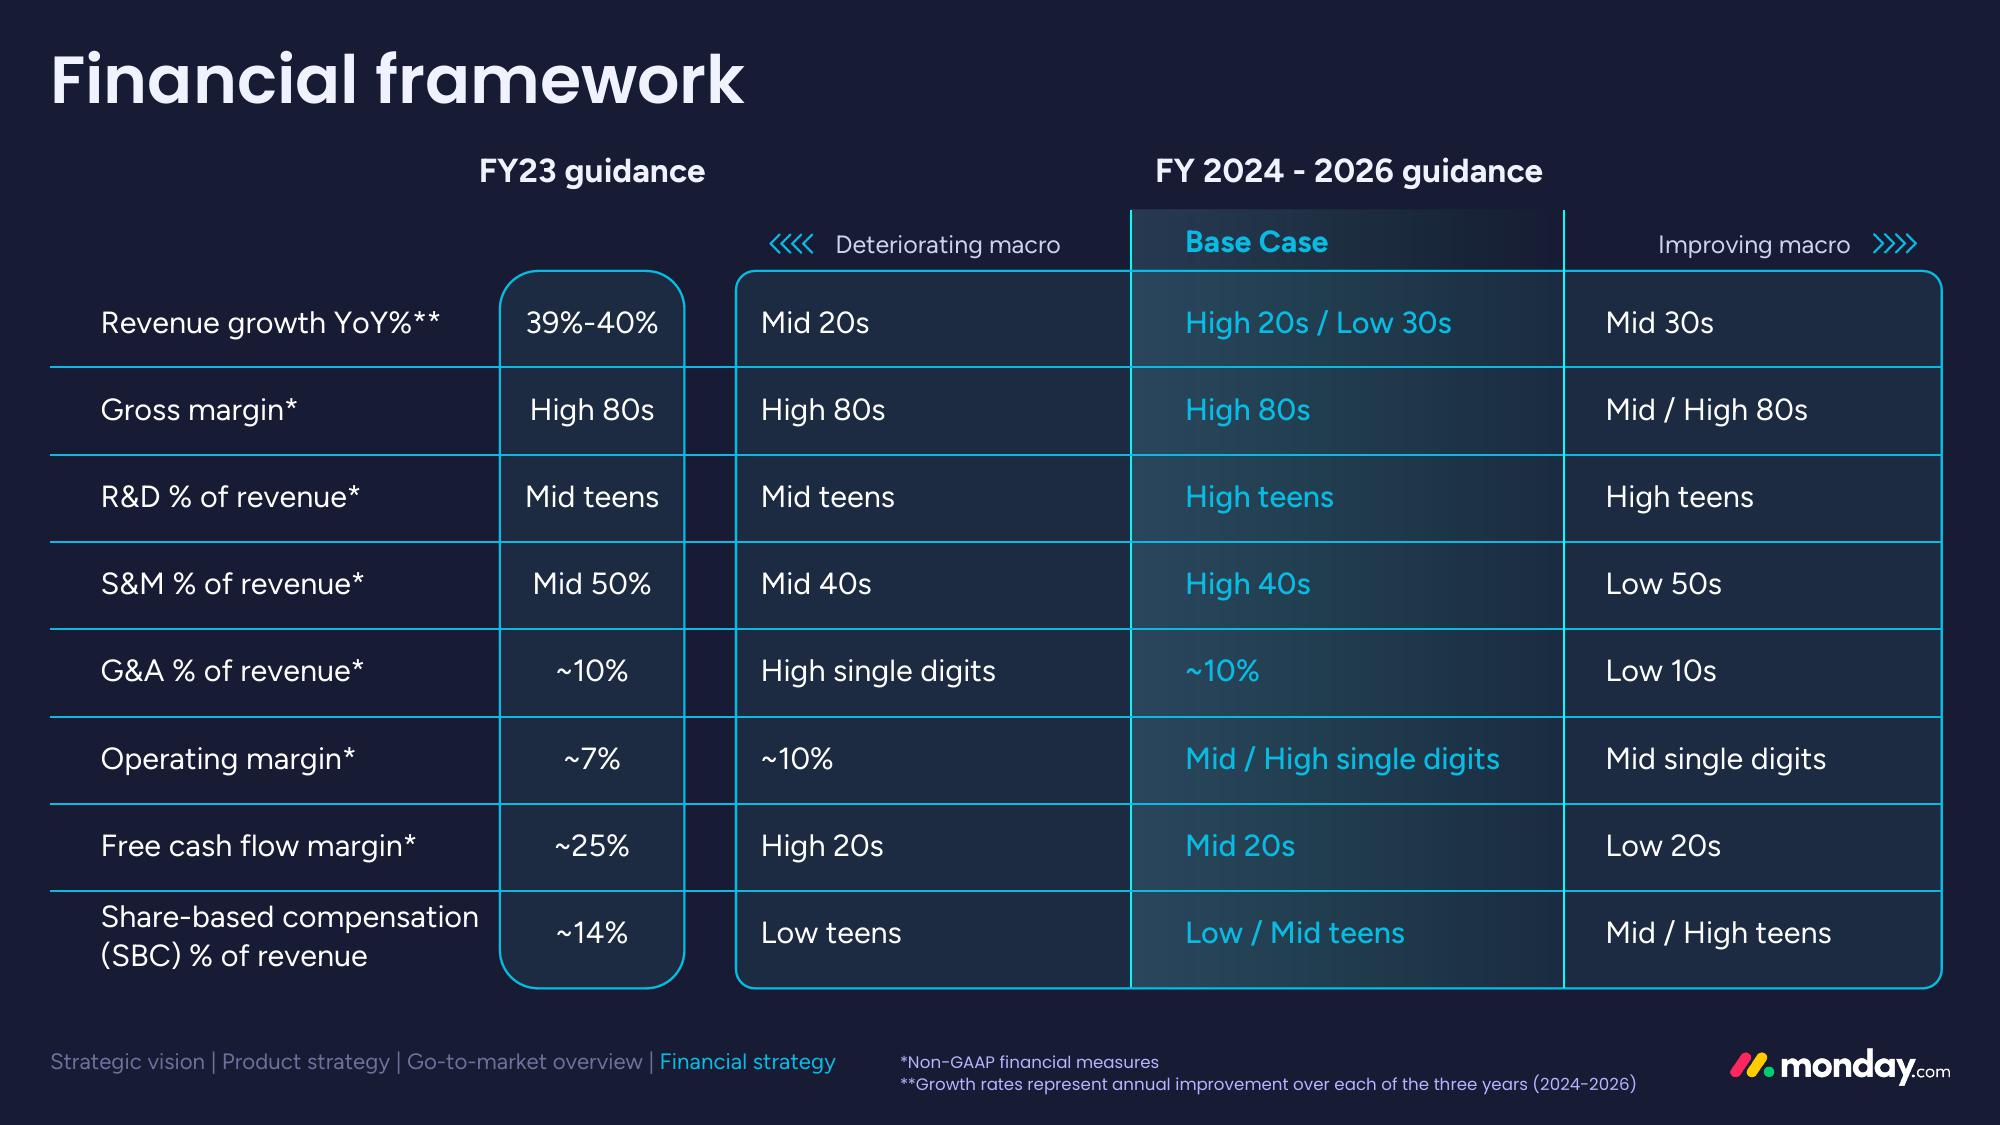
Financial framework
FY23 guidance
Revenue growth YoY%**
Gross margin*
R&D % of revenue*
S&M % of revenue*
G&A % of revenue*
Operating margin*
Free cash flow margin*
Share-based compensation
(SBC)% of revenue
39%-40%
High 80s
Mid teens
Mid 50%
~10%
~7%
~25%
~14%
Deteriorating macro
Mid 20s
High 80s
Mid teens
Mid 40s
High single digits
~10%
High 20s
Low teens
Strategic vision | Product strategy | Go-to-market overview | Financial strategy
FY 2024 - 2026 guidance
Base Case
High 20s / Low 30s
High 80s
High teens
High 40s
~10%
Mid/High single digits
Mid 20s
Low/Mid teens
Improving macro
Mid 30s
Mid/High 80s
High teens
Low 50s
Low 10s
Mid single digits
Low 20s
Mid/High teens
*Non-GAAP financial measures
**Growth rates represent annual improvement over each of the three years (2024-2026)
11.monday.comView entire presentation