WeWork Investor Presentation Deck
Flex office is at an inflection point in the U.S. and Globally
Flex as a % of Commercial Real Estate
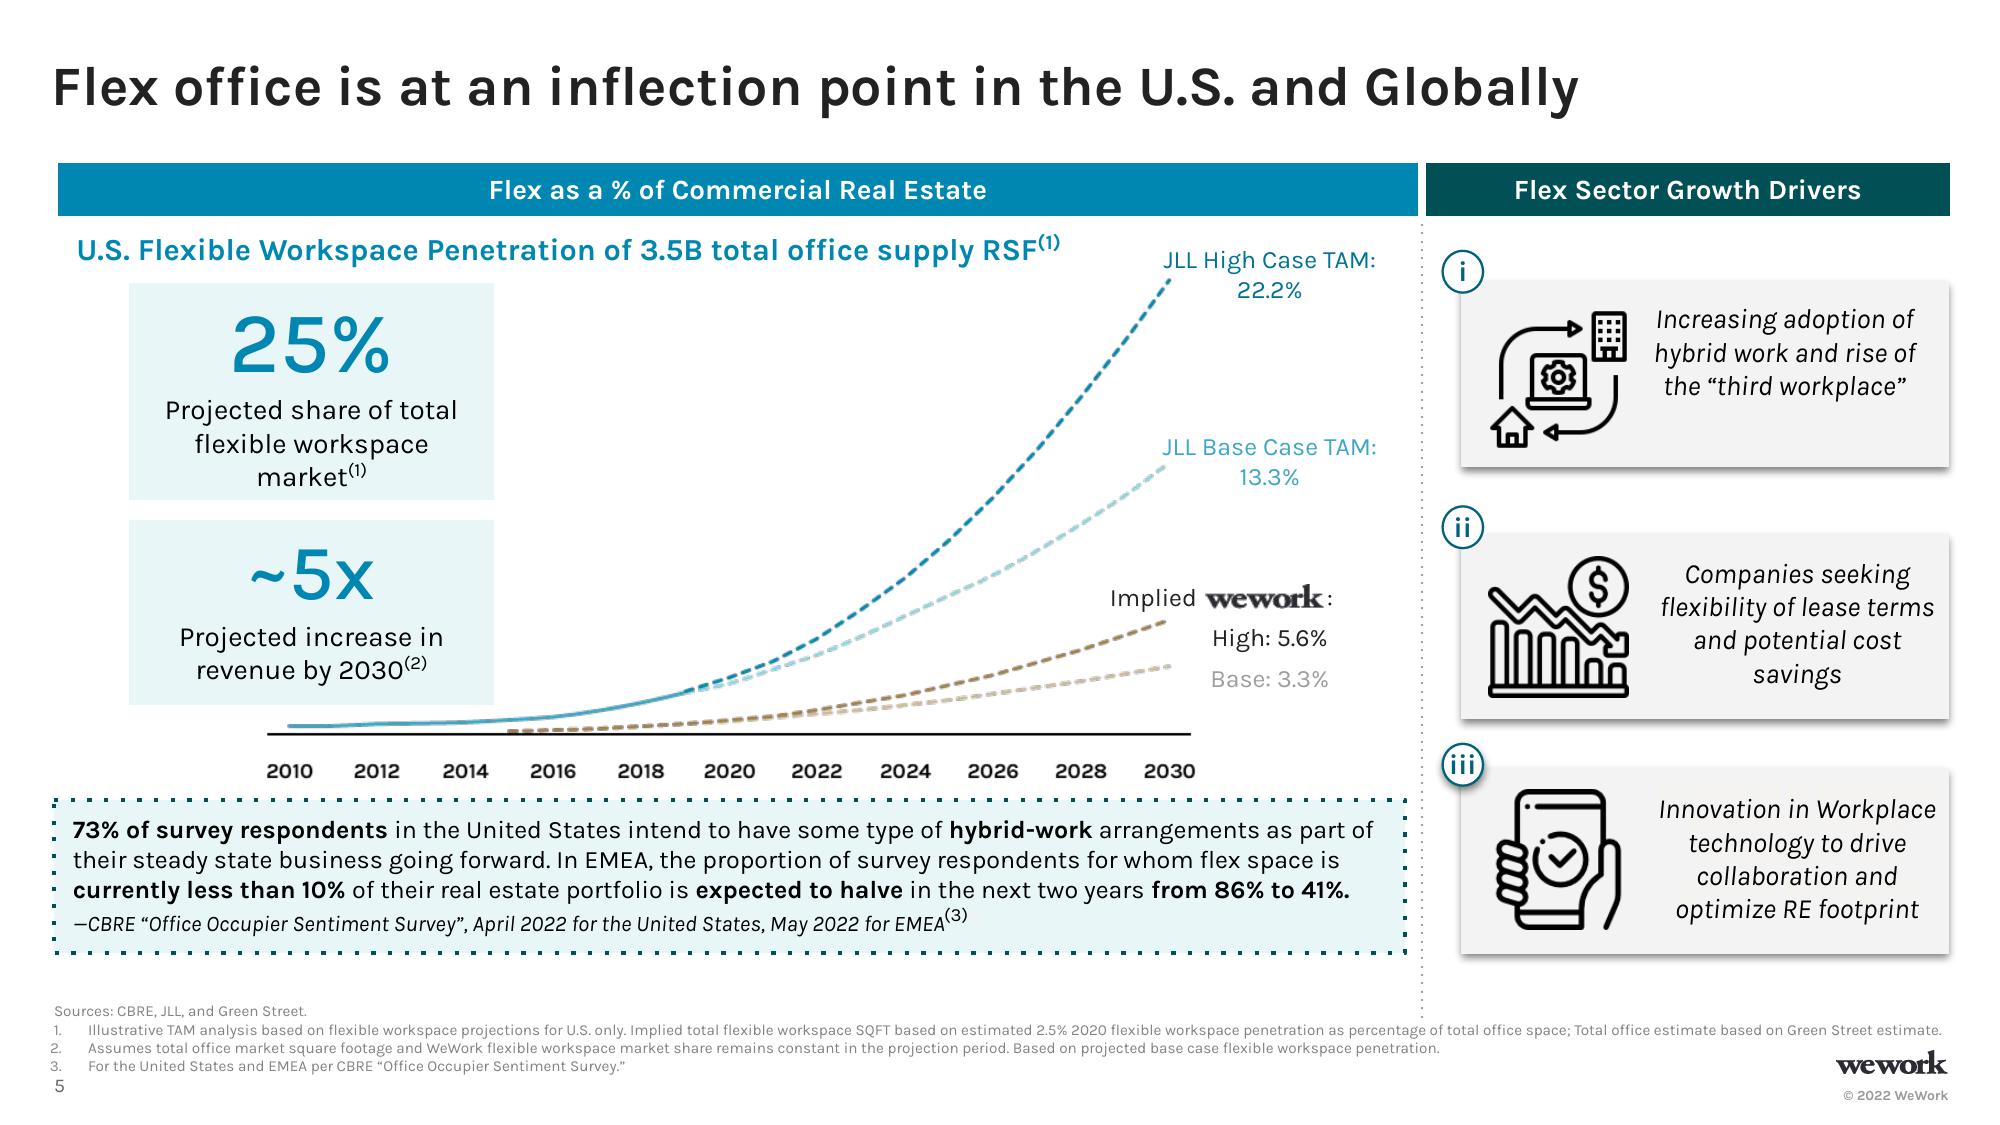
U.S. Flexible Workspace Penetration of 3.5B total office supply RSF (1)
5
25%
Projected share of total
flexible workspace
market (¹)
~5x
Projected increase in
revenue by 2030 (2)
2010 2012
2014 2016 2018
2020 2022 2024 2026 2028
JLL High Case TAM:
22.2%
JLL Base Case TAM:
13.3%
Implied wework:
High: 5.6%
Base: 3.3%
2030
▪▪▪▪
73% of survey respondents in the United States intend to have some type of hybrid-work arrangements as part of
their steady state business going forward. In EMEA, the proportion of survey respondents for whom flex space is
currently less than 10% of their real estate portfolio is expected to halve in the next two years from 86% to 41%.
-CBRE "Office Occupier Sentiment Survey", April 2022 for the United States, May 2022 for EMEA(3)
(ii)
(iii)
Flex Sector Growth Drivers
($
Increasing adoption of
hybrid work and rise of
the "third workplace"
Companies seeking
flexibility of lease terms
and potential cost
savings
Innovation in Workplace
technology to drive
collaboration and
optimize RE footprint
Sources: CBRE, JLL, and Green Street.
1. Illustrative TAM analysis based on flexible workspace projections for U.S. only. Implied total flexible workspace SQFT based on estimated 2.5% 2020 flexible workspace penetration as percentage of total office space; Total office estimate based on Green Street estimate.
2. Assumes total office market square footage and WeWork flexible workspace market share remains constant in the projection period. Based on projected base case flexible workspace penetration.
3.
For the United States and EMEA per CBRE "Office Occupier Sentiment Survey."
wework
Ⓒ2022 WeWorkView entire presentation