monday.com Investor Day Presentation Deck slide image

monday.com Investor Day Presentation Deck

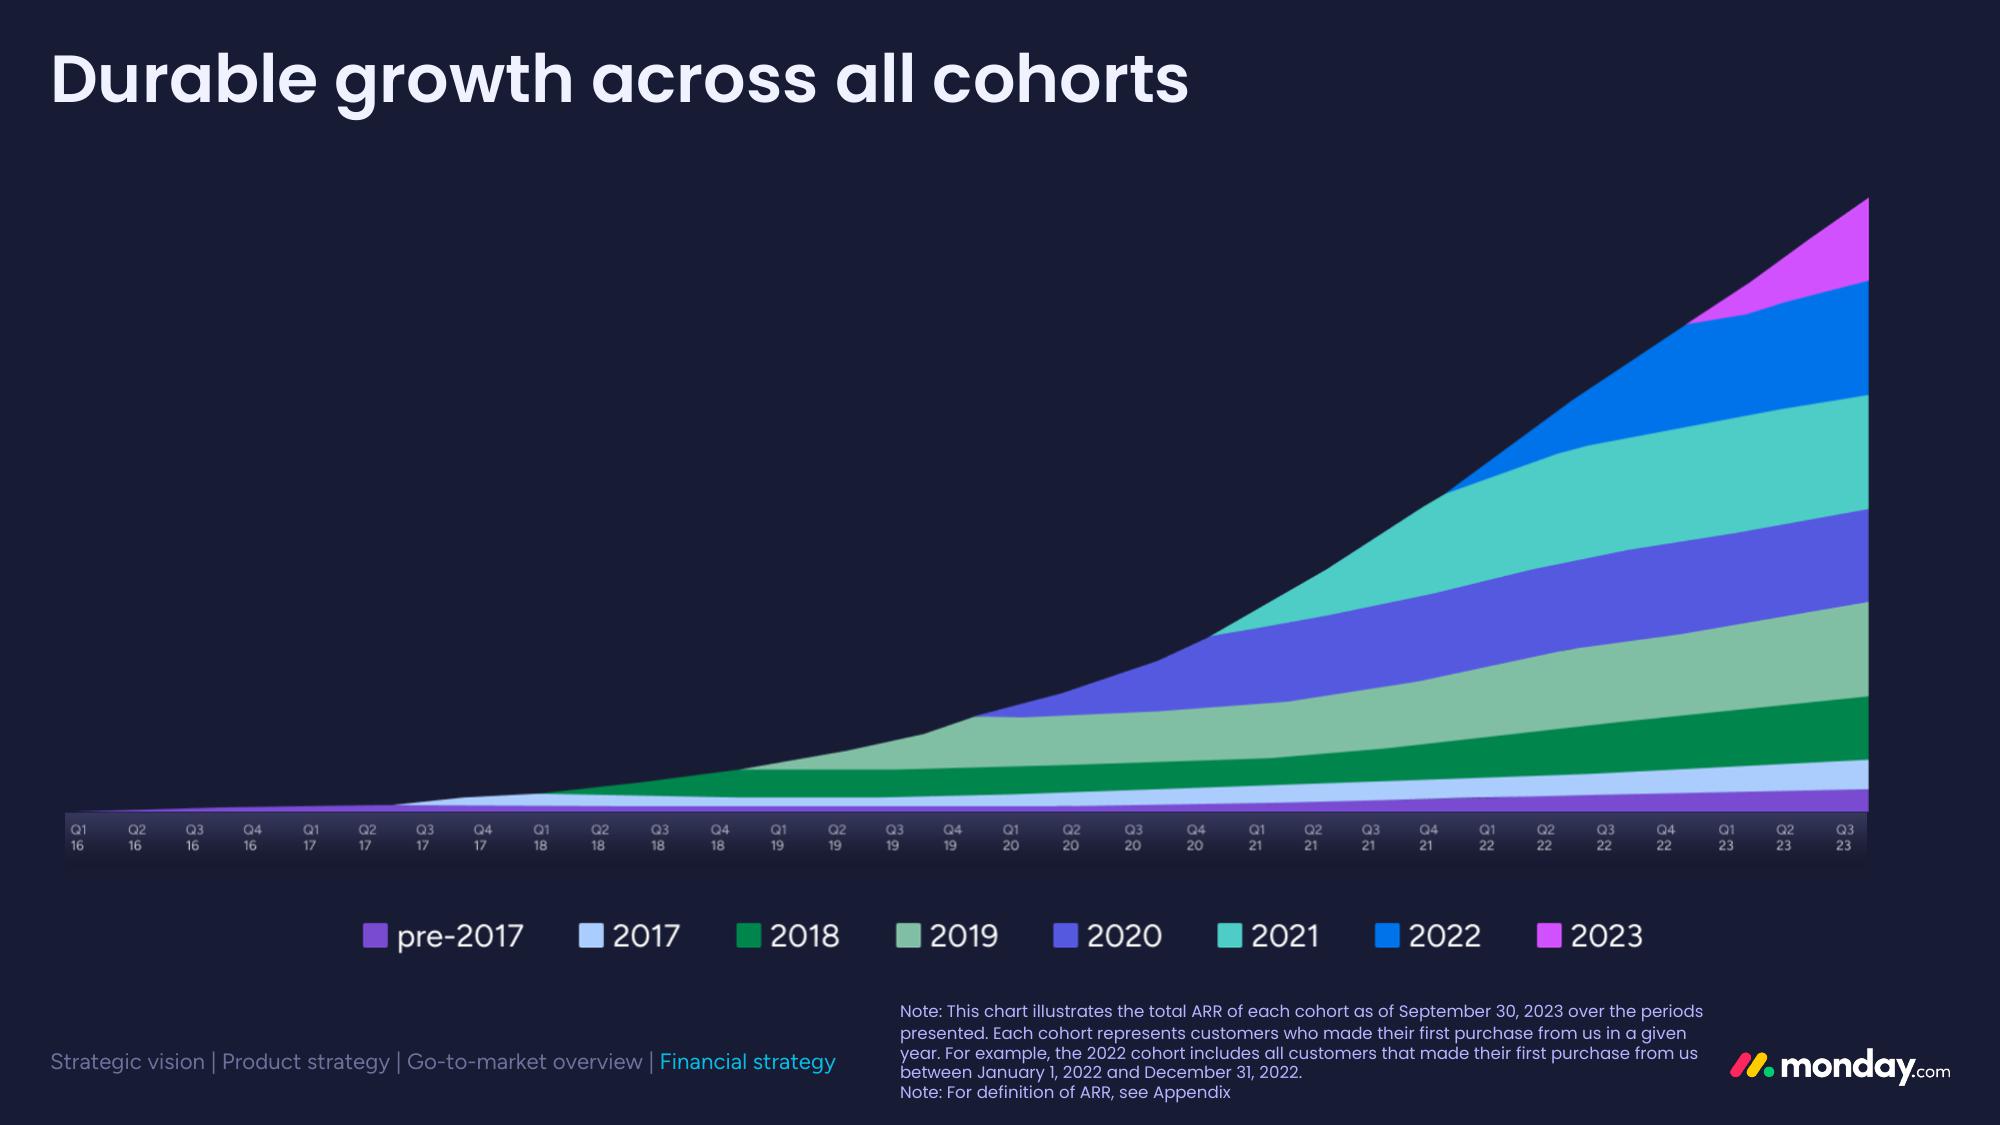
Durable growth across all cohorts Q1 16 Q2 16 Q3 16 Q4 16 Q1 17 Q2 17 Q3 17 Q4 17 pre-2017 Q1 18 Q2 18 Q3 18 2017 Q4 18 Q1 19 Q2 19 2018 Strategic vision | Product strategy | Go-to-market overview | Financial strategy Q3 19 Q4 19 2019 Q1 20 Q2 20 Q3 20 2020 Q4 20 Q1 21 Q2 21 2021 Q3 21 Q4 21 Q1 22 2022 Q2 22 Q3 22 2023 Q4 22 Note: This chart illustrates the total ARR of each cohort as of September 30, 2023 over the periods presented. Each cohort represents customers who made their first purchase from us in a given year. For example, the 2022 cohort includes all customers that made their first purchase from us between January 1, 2022 and December 31, 2022. Note: For definition of ARR, see Appendix Q1 23 Q2 23 Q3 23 11.monday.com
View entire presentation