AstraZeneca Investor Day Presentation Deck
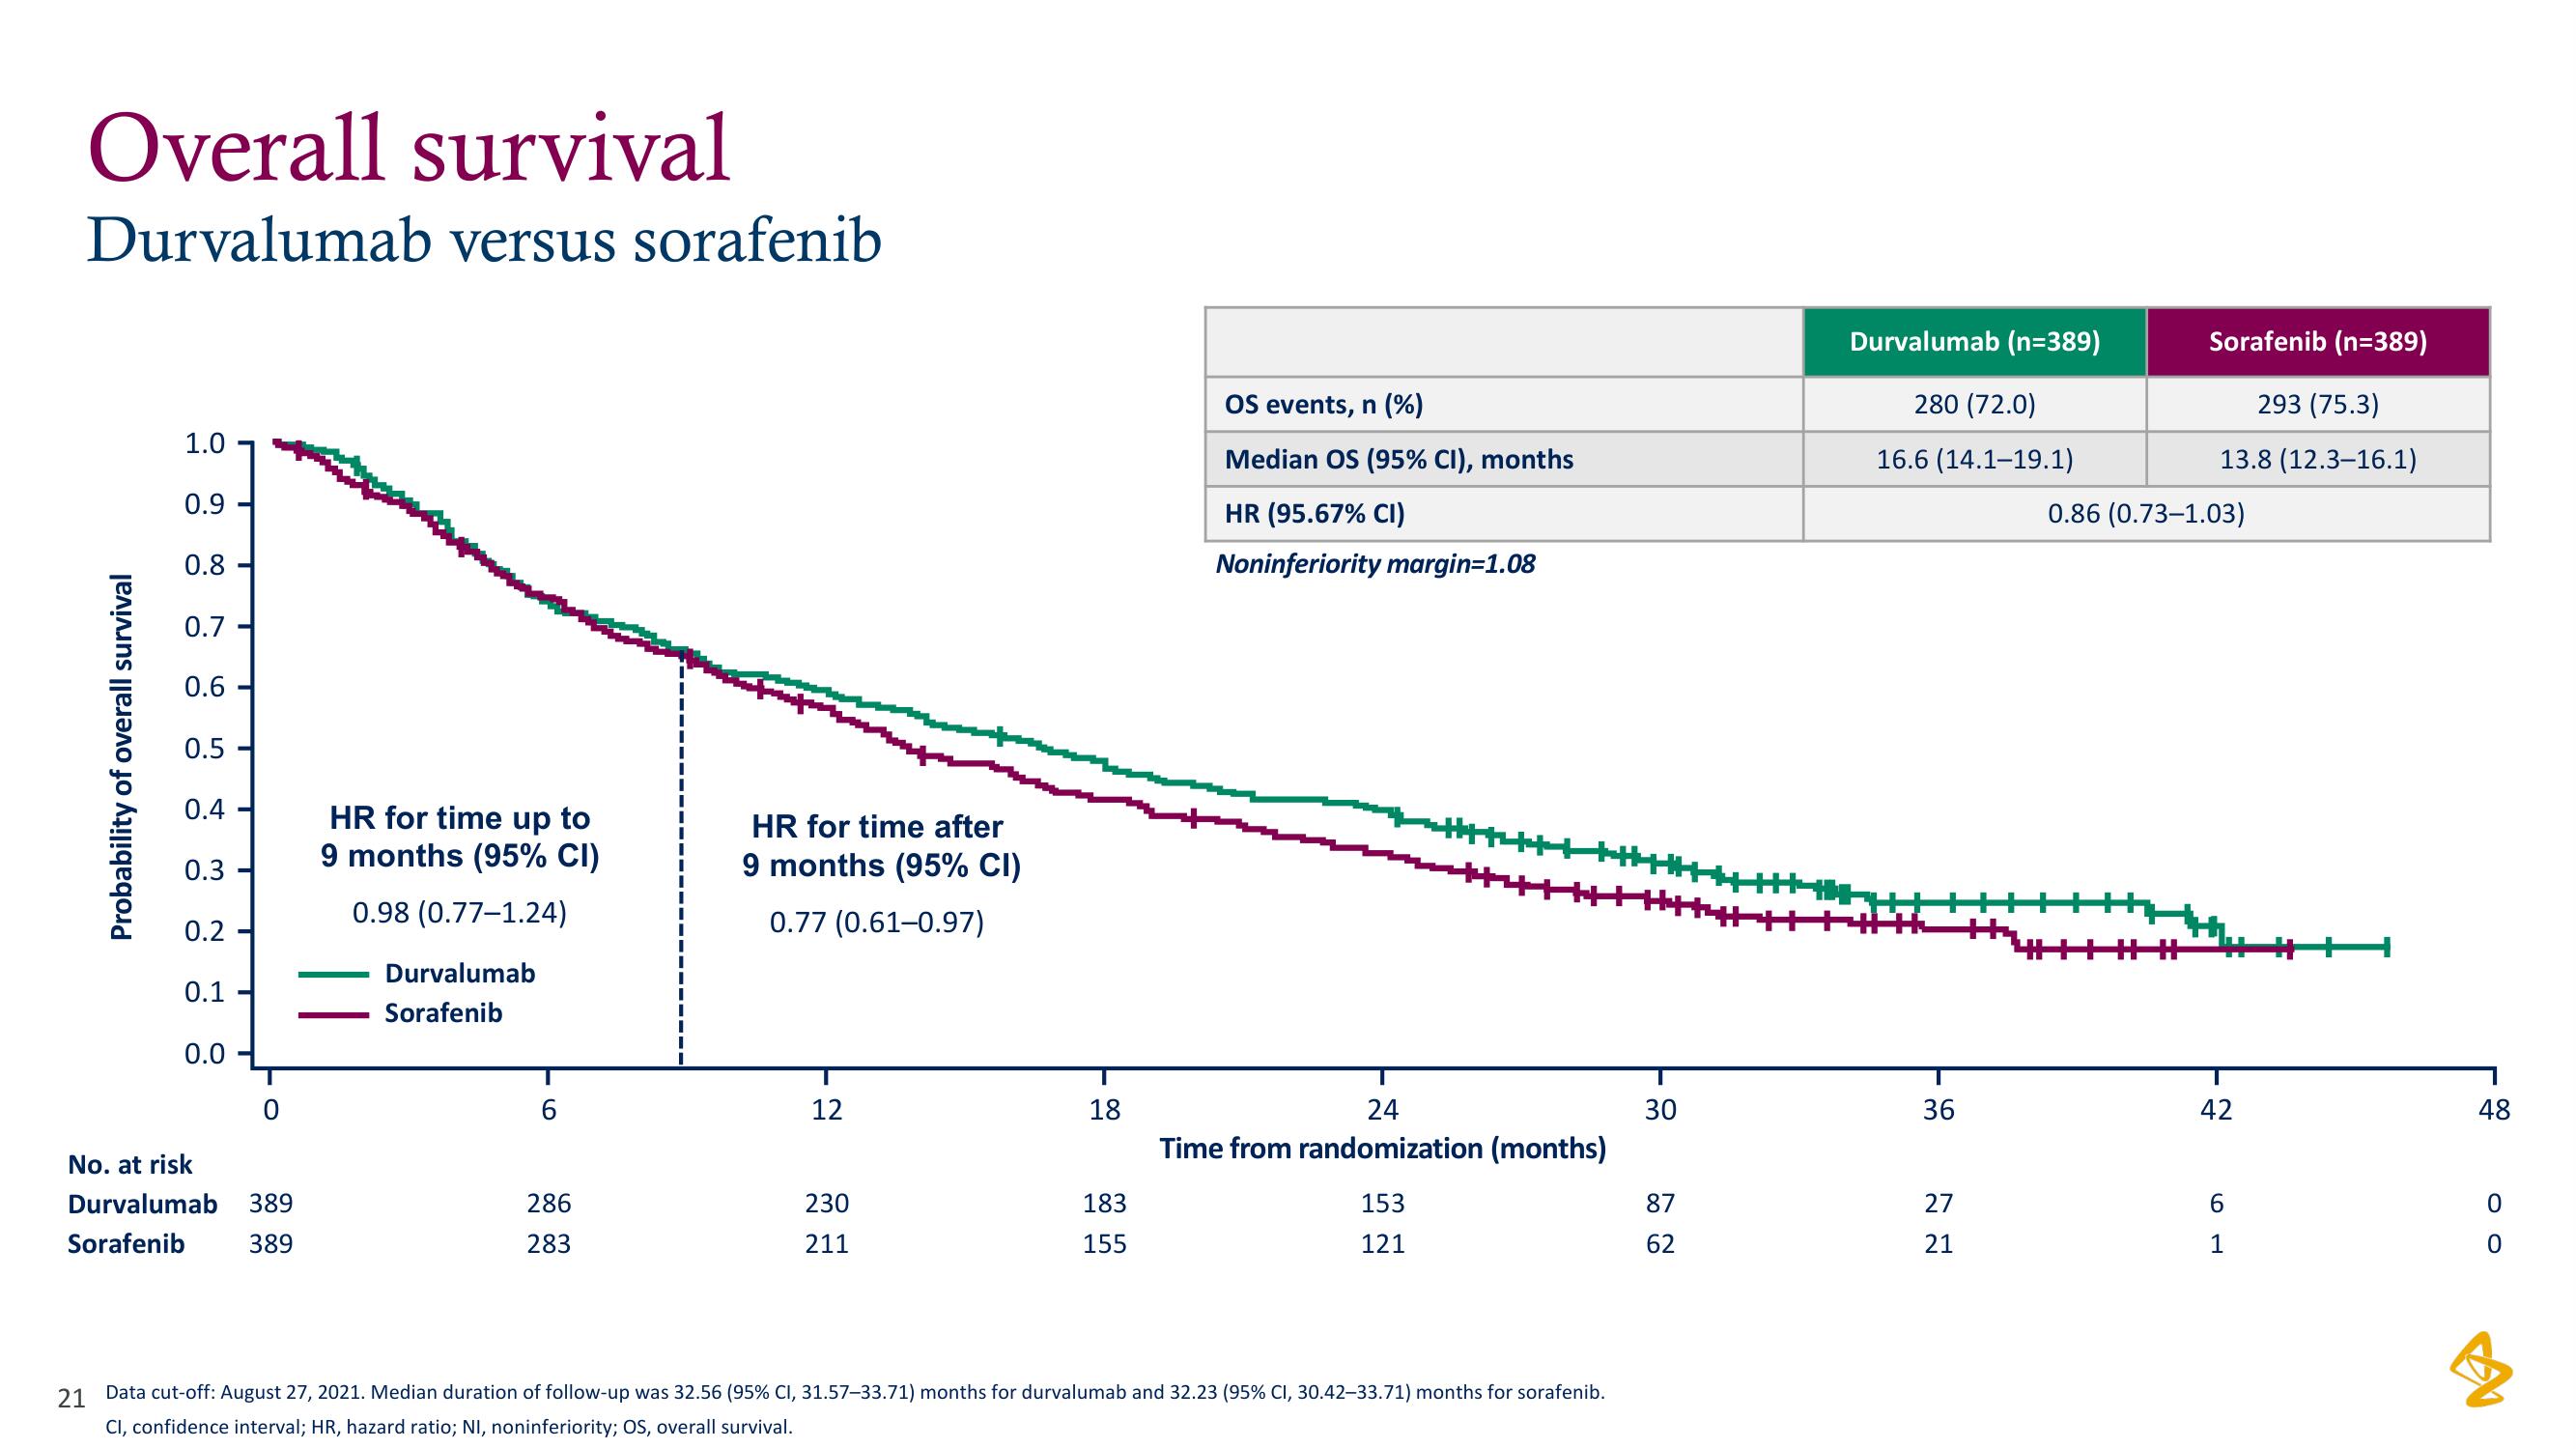
Overall survival
Durvalumab versus sorafenib
Probability of overall survival
1.0
0.9
0.8
0.7
0.6
0.5
0.4
0.3
0.2
0.1
0.0
0
No. at risk
Durvalumab 389
Sorafenib 389
HR for time up to
9 months (95% CI)
0.98 (0.77-1.24)
Durvalumab
Sorafenib
6
286
283
HR for time after
9 months (95% CI)
0.77 (0.61-0.97)
12
230
211
18
183
155
OS events, n (%)
Median OS (95% CI), months
HR (95.67% CI)
Noninferiority margin-1.08
24
Time from randomization (months)
153
121
21 Data cut-off: August 27, 2021. Median duration of follow-up was 32.56 (95% CI, 31.57-33.71) months for durvalumab and 32.23 (95% CI, 30.42-33.71) months for sorafenib.
CI, confidence interval; HR, hazard ratio; NI, noninferiority; OS, overall survival.
30
87
62
Durvalumab (n=389)
280 (72.0)
16.6 (14.1-19.1)
36
27
21
Sorafenib (n=389)
293 (75.3)
13.8 (12.3-16.1)
0.86 (0.73-1.03)
42
6
1
48
O O
0View entire presentation