Asos Results Presentation Deck
© 2023 asos
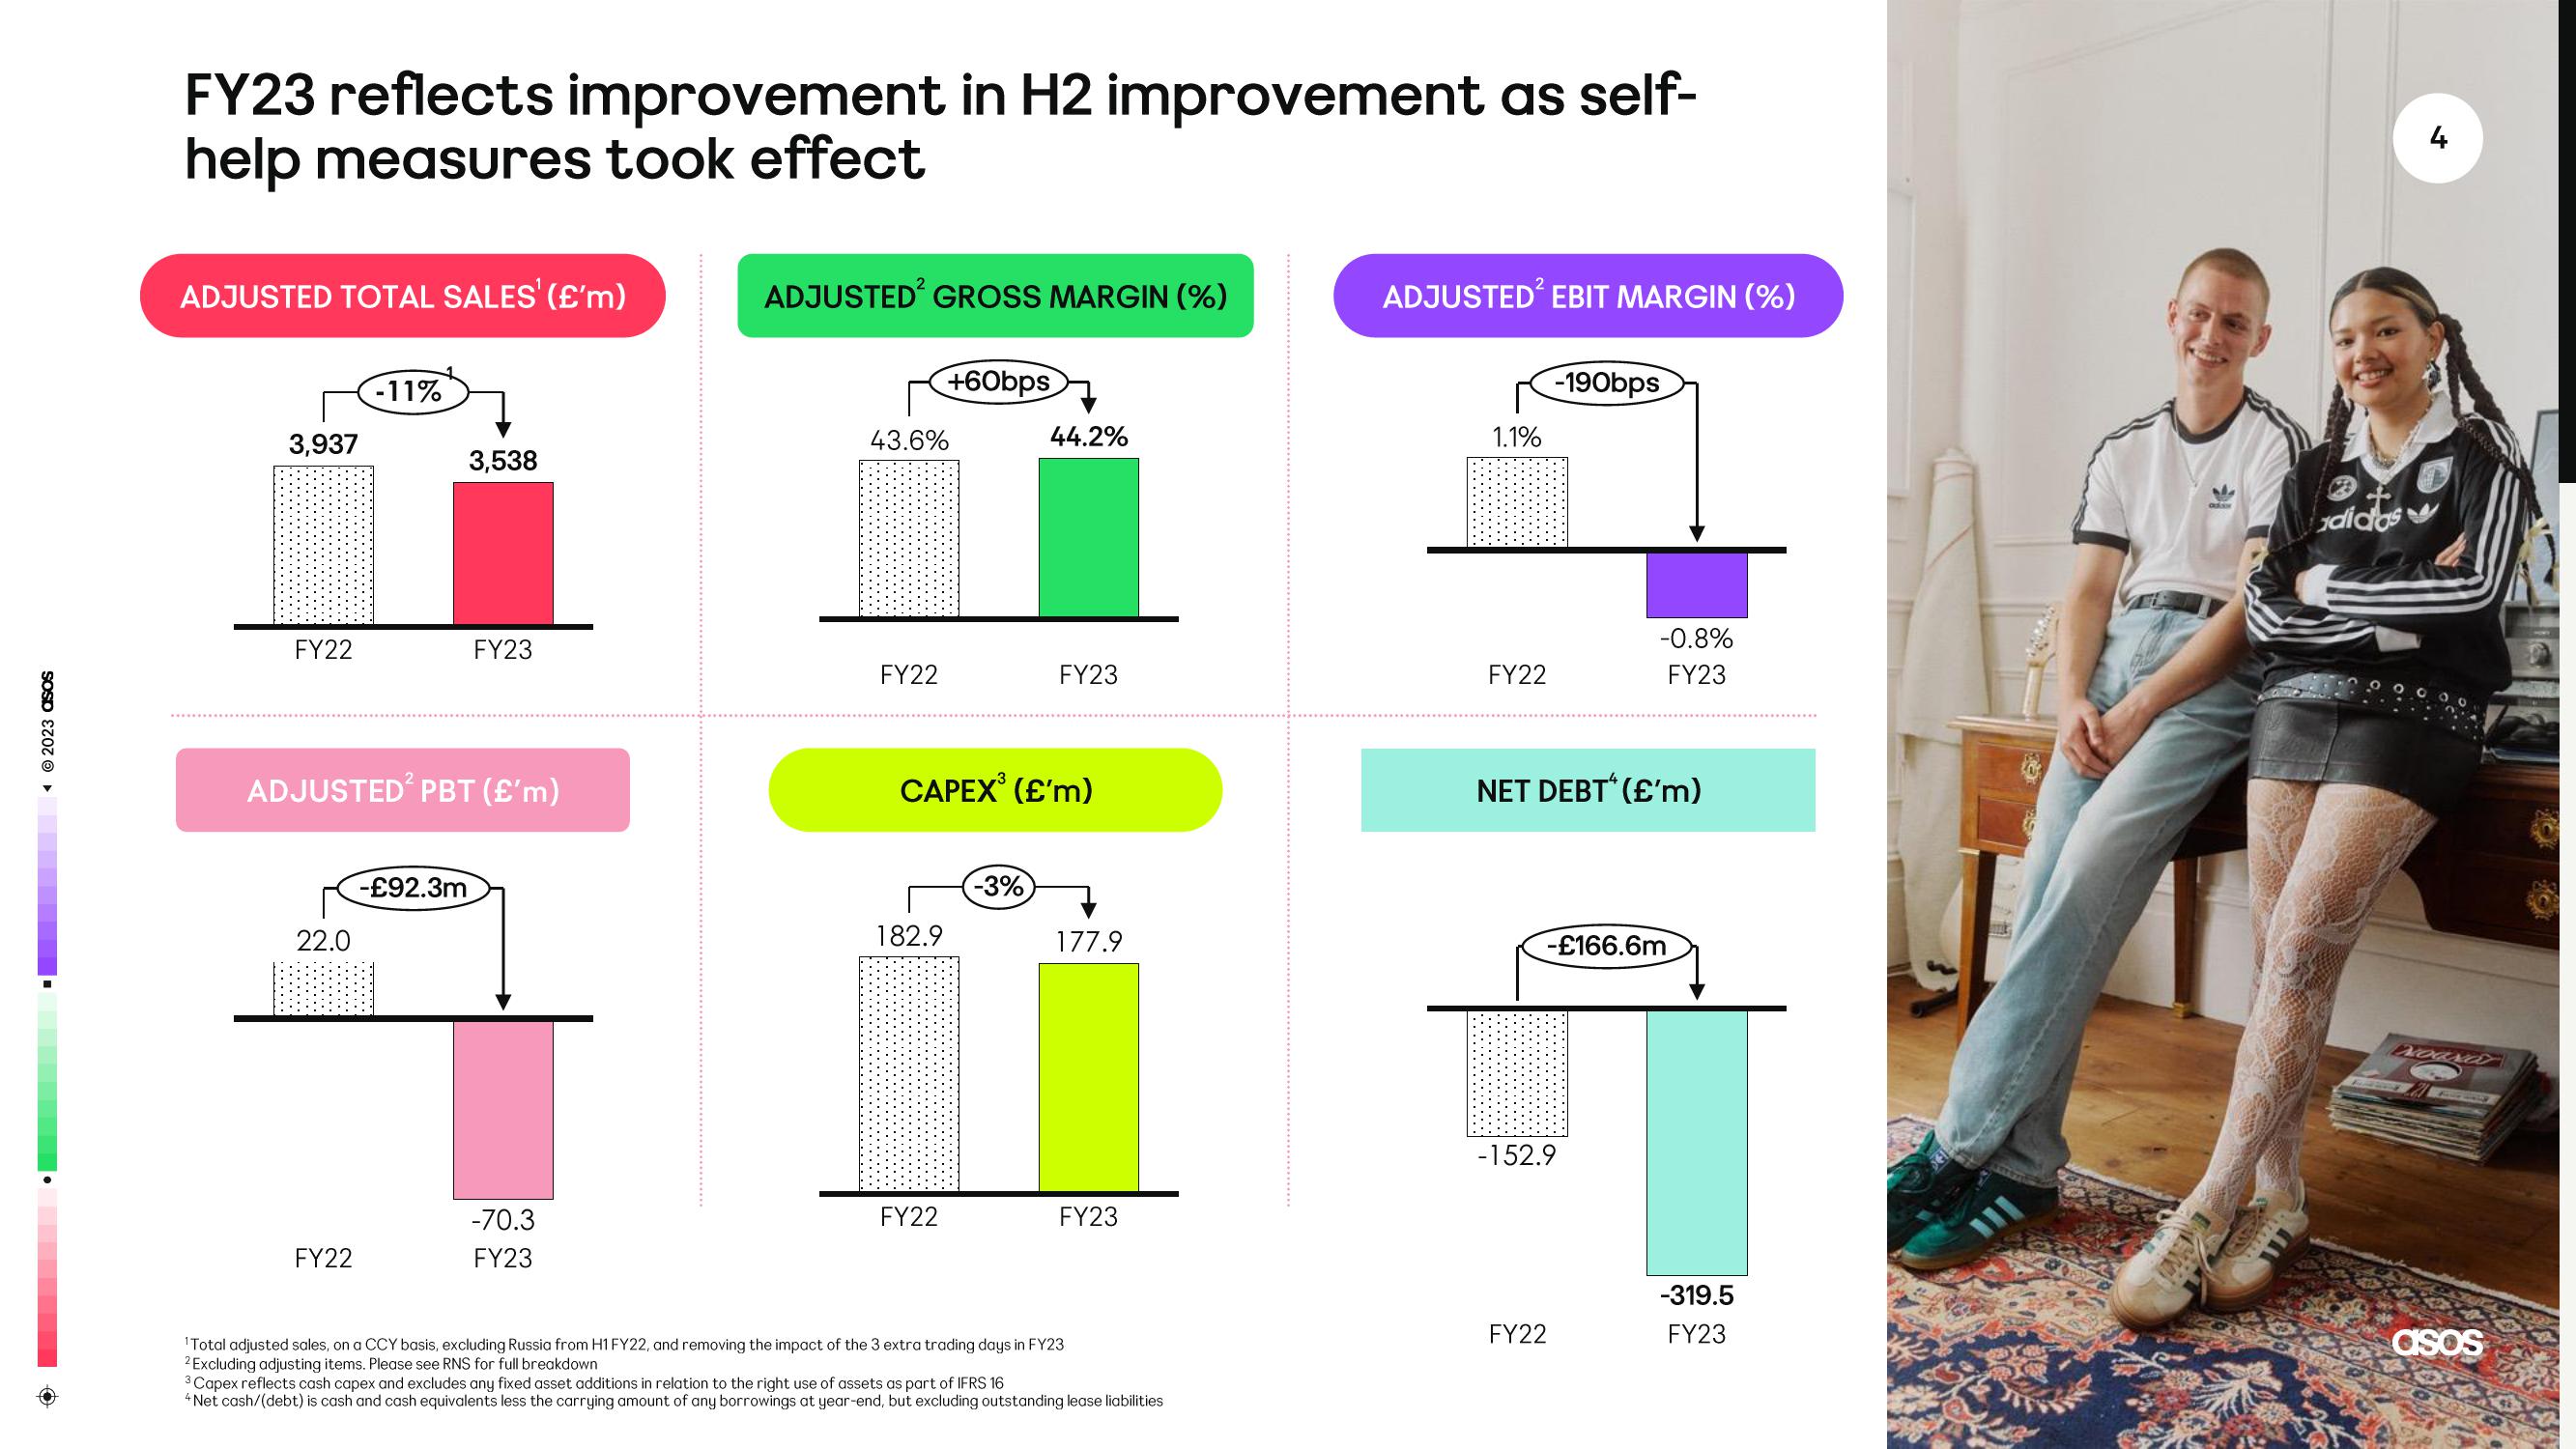
FY23 reflects improvement in H2 improvement as self-
help measures took effect
ADJUSTED TOTAL SALES' (£'m)
3,937
FY22
22.0
-11%
FY22
ADJUSTED² PBT (£'m)
3,538
-£92.3m
FY23
-70.3
FY23
ADJUSTED² GROSS MARGIN (%)
43.6%
FY22
182.9
+60bps
FY22
CAPEX³ (£'m)
44.2%
-3%
FY23
177.9
FY23
¹Total adjusted sales, on a CCY basis, excluding Russia from H1 FY22, and removing the impact of the 3 extra trading days in FY23
2 Excluding adjusting items. Please see RNS for full breakdown
3 Capex reflects cash capex and excludes any fixed asset additions in relation to the right use of assets as part of IFRS 16
4Net cash/(debt) is cash and cash equivalents less the carrying amount of any borrowings at year-end, but excluding outstanding lease liabilities
ADJUSTED² EBIT MARGIN (%)
1.1%
FY22
-190bps
NET DEBT (£'m)
-0.8%
FY23
-£166.6m
-152.9
FY22
-319.5
FY23
adSw
adidas
4
asosView entire presentation