Next.e.GO Investor Update
Valuation
Financing
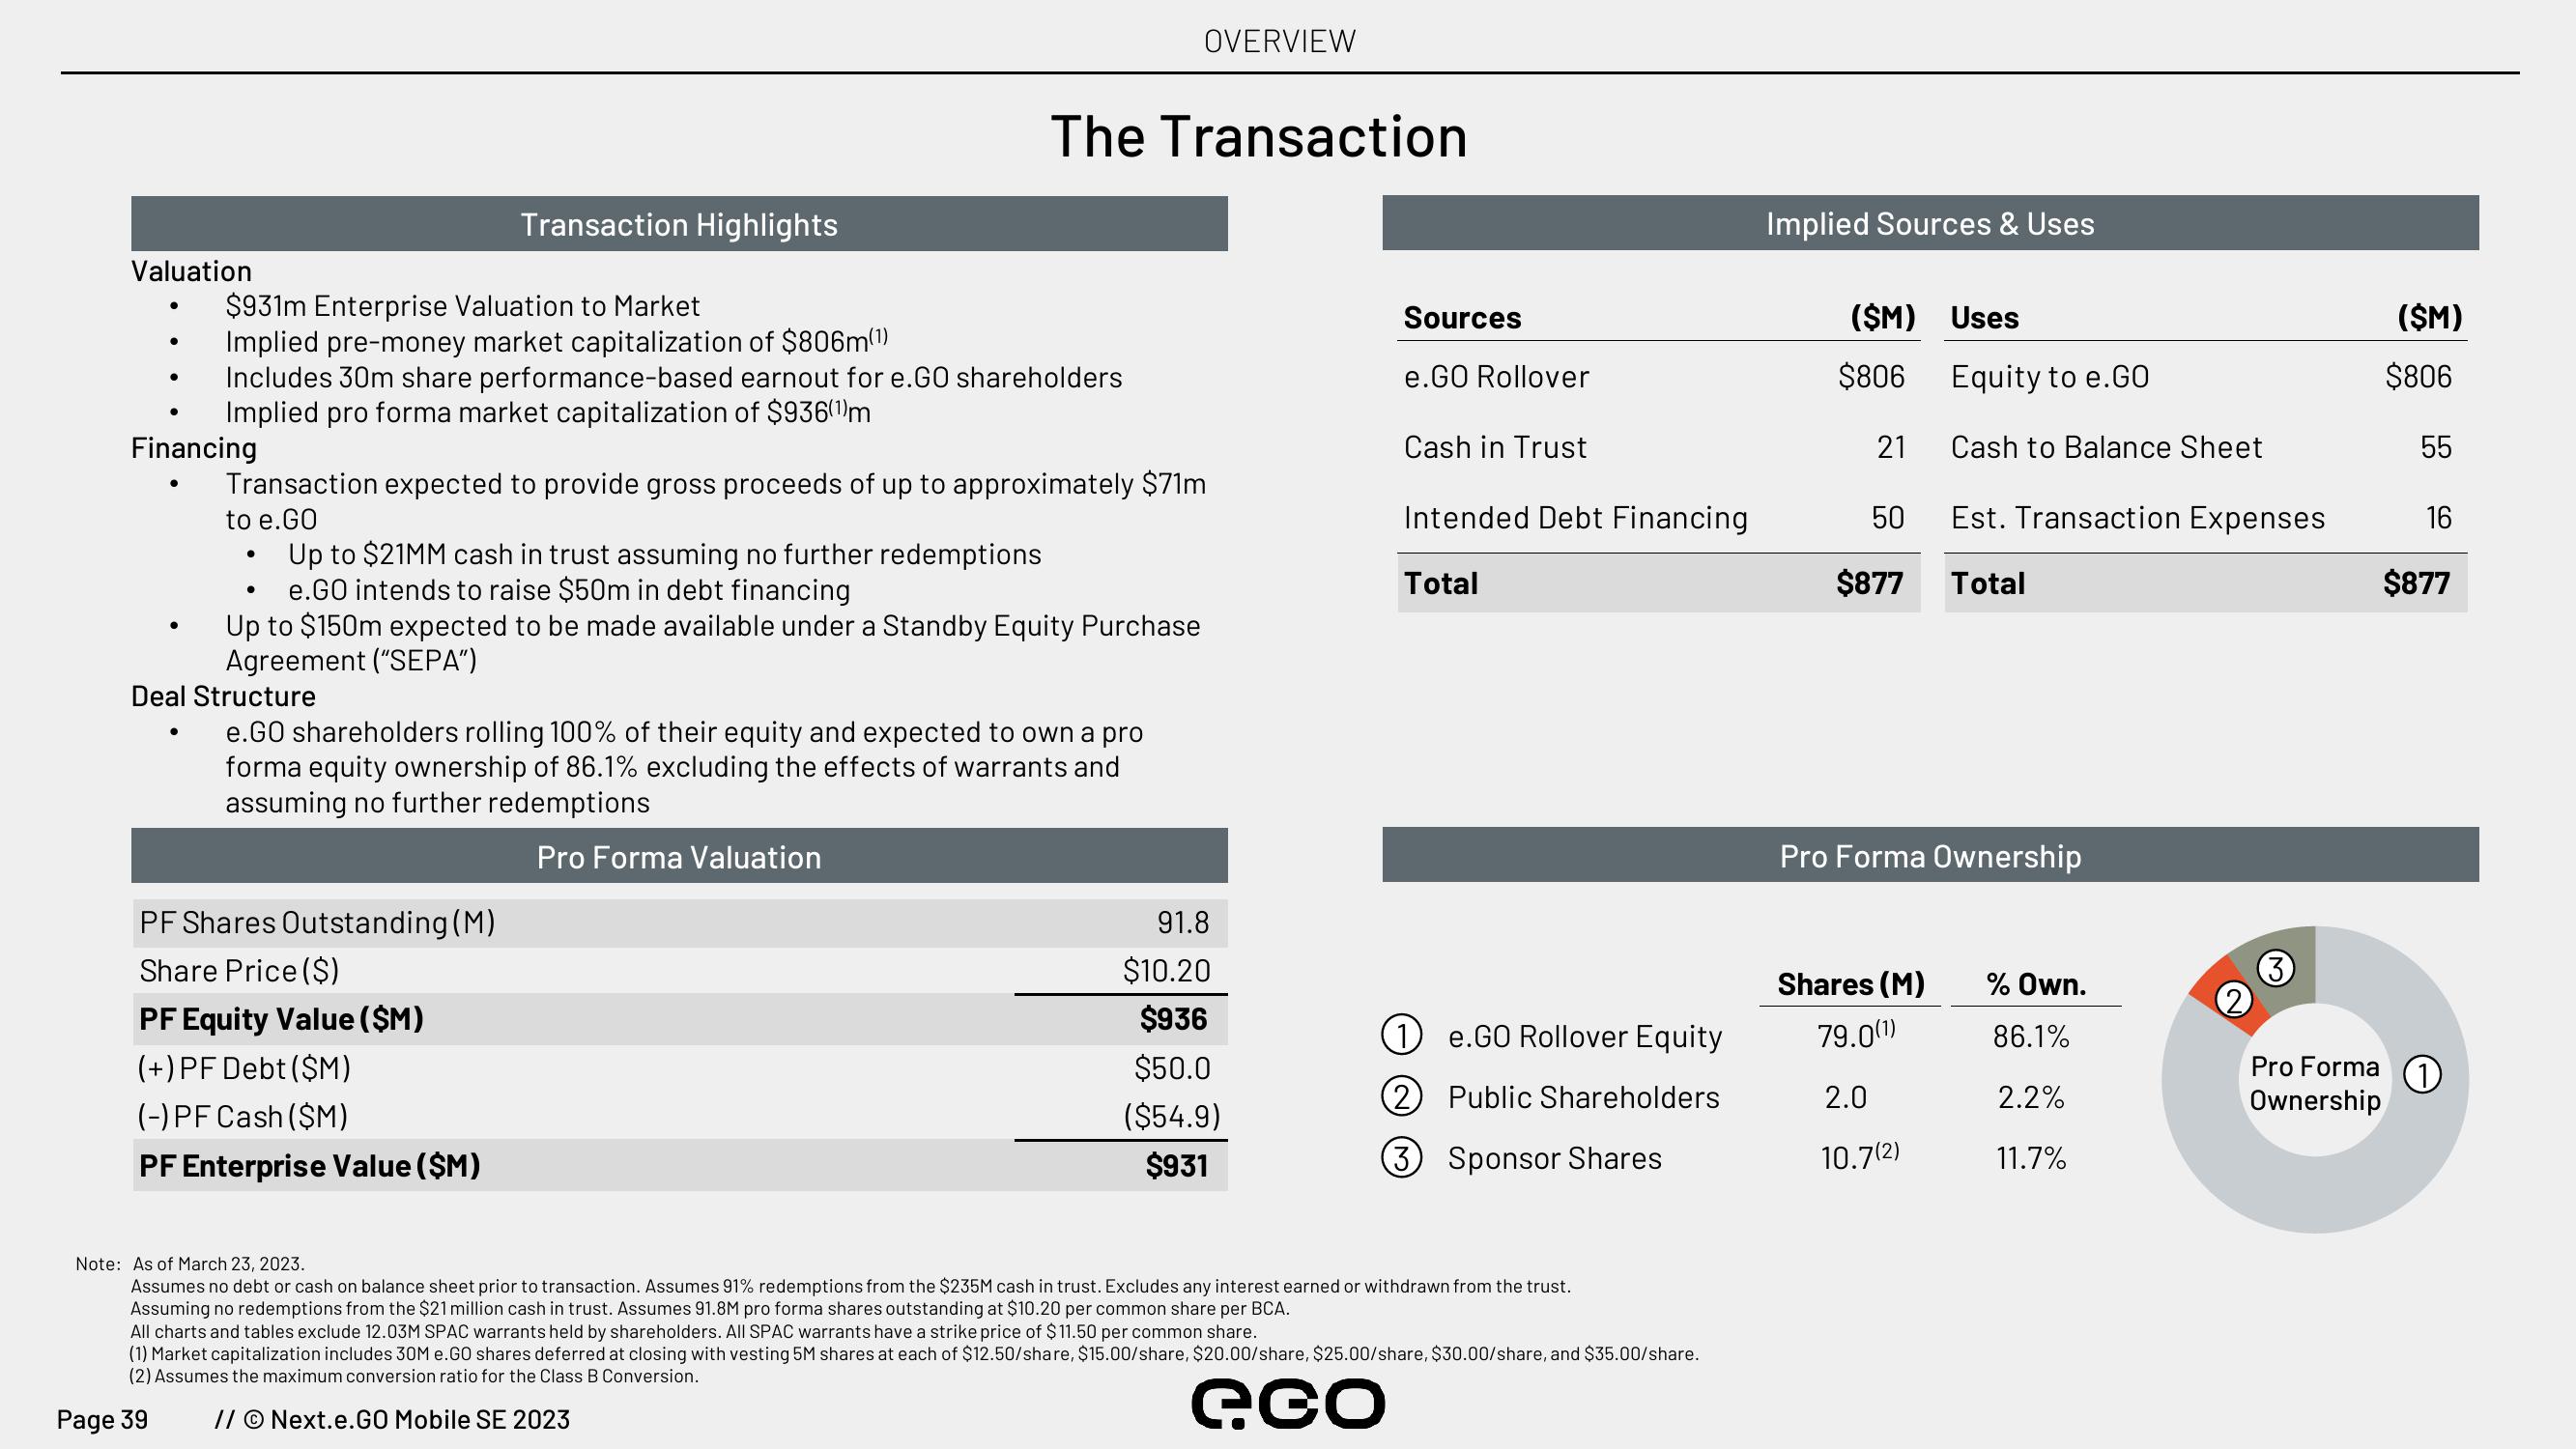
$931m Enterprise Valuation to Market
Implied pre-money market capitalization of $806m(¹)
Includes 30m share performance-based earnout for e.GO shareholders
Implied pro forma market capitalization of $936(¹)m
●
Transaction Highlights
Transaction expected to provide gross proceeds of up to approximately $71m
to e.GO
Up to $21MM cash in trust assuming no further redemptions
e.GO intends to raise $50m in debt financing
Up to $150m expected to be made available under a Standby Equity Purchase
Agreement ("SEPA")
●
Deal Structure
The Transaction
PF Shares Outstanding (M)
Share Price ($)
PF Equity Value ($M)
(+) PF Debt ($M)
(-) PF Cash ($M)
PF Enterprise Value ($M)
OVERVIEW
e.GO shareholders rolling 100% of their equity and expected to own a pro
forma equity ownership of 86.1% excluding the effects of warrants and
assuming no further redemptions
Pro Forma Valuation
91.8
$10.20
$936
$50.0
($54.9)
$931
Sources
e.GO Rollover
Cash in Trust
Intended Debt Financing
Total
1e.GO Rollover Equity
(2) Public Shareholders
3 Sponsor Shares
Note: As of March 23, 2023.
Assumes no debt or cash on balance sheet prior to transaction. Assumes 91% redemptions from the $235M cash in trust. Excludes any interest earned or withdrawn from the trust.
Assuming no redemptions from the $21 million cash in trust. Assumes 91.8M pro forma shares outstanding at $10.20 per common share per BCA.
All charts and tables exclude 12.03M SPAC warrants held by shareholders. All SPAC warrants have a strike price of $11.50 per common share.
(1) Market capitalization includes 30M e.GO shares deferred at closing with vesting 5M shares at each of $12.50/share, $15.00/share, $20.00/share, $25.00/share, $30.00/share, and $35.00/share.
(2) Assumes the maximum conversion ratio for the Class B Conversion.
Page 39
// © Next.e.GO Mobile SE 2023
eco
Implied Sources & Uses
($M) Uses
$806
50
$877
Equity to e.GO
Cash to Balance Sheet
Shares (M)
79.0(1¹)
2.0
10.7(2)
Est. Transaction Expenses
Total
Pro Forma Ownership
% Own.
86.1%
2.2%
11.7%
Pro Forma
Ownership
($M)
$806
55
16
$877View entire presentation