Credit Suisse Investment Banking Pitch Book
CONFIDENTIAL
Fo
130
Fire
18
www.
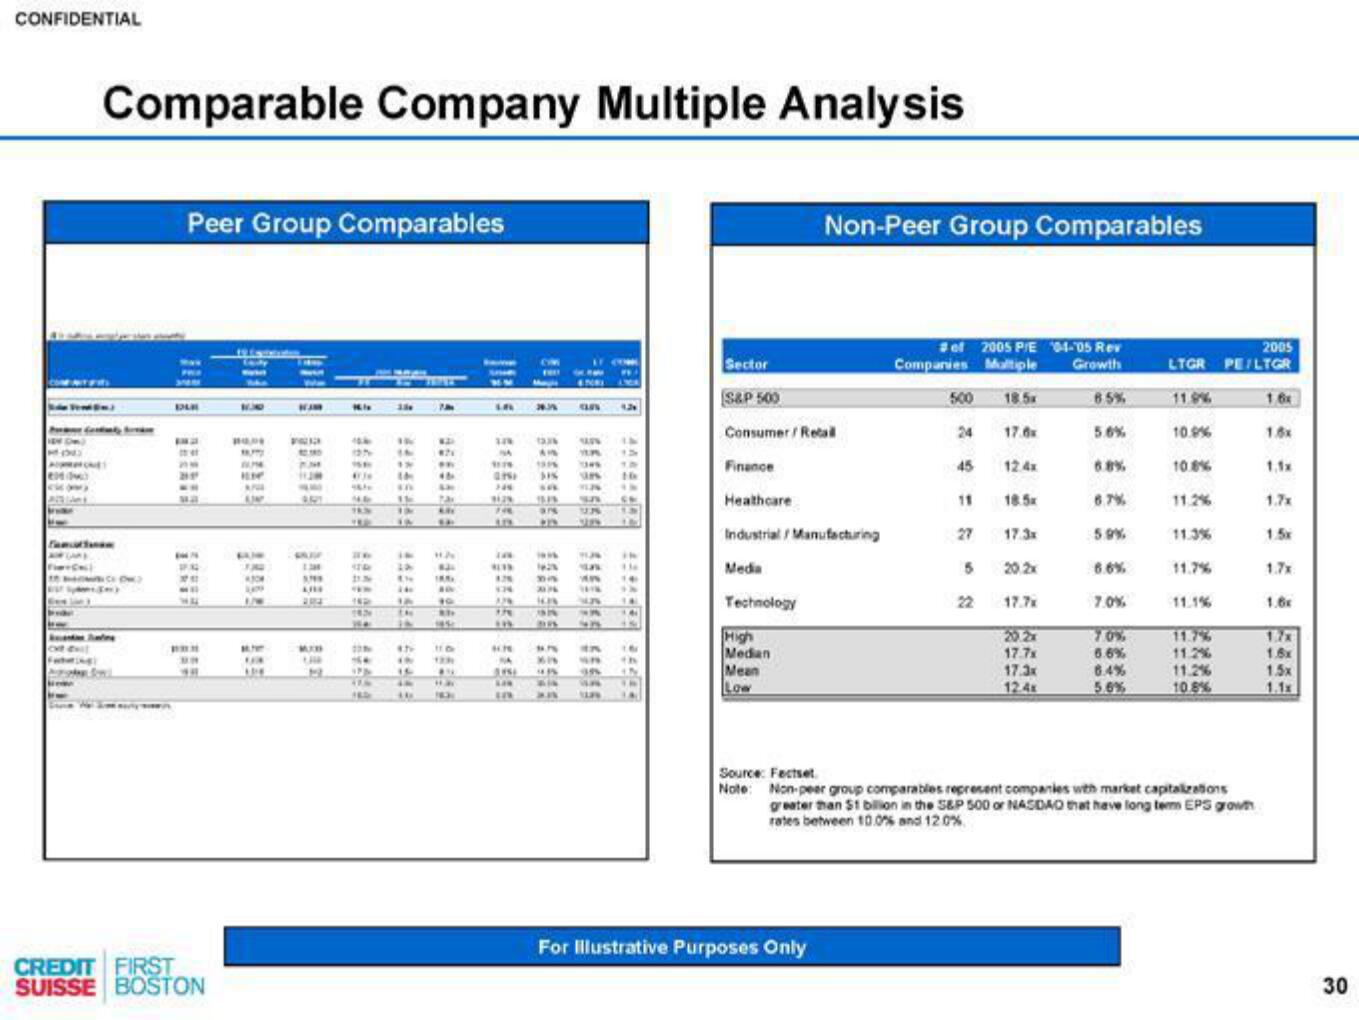
Comparable Company Multiple Analysis
DHC)
Peer Group Comparables
DER
36
3.4
MA
WA
SP.AG
ME
MIL
WE
PRE
39
CREDIT FIRST
SUISSE BOSTON
19.Estados
11:30
HAR
PUPPY
AUPM
ILM
AP
AJMP
FAW
FRU
4.3CM
1699
BELT
FIA
WAM
BLOND
PMM
11JM
1.200
5799
AFES
204
MOB
UR
3
16.1
10.4
127
IN
SF
IN
frie th
484
48
STD
ILN
142
16.30
Wa
111
14
1.1
414
In
11
10
IN
IN
LIV
th
14
ENC
IN
the
IN
16
44
46
W21
P
46
LM
24
ARE
82
189.
ANN
40
445
11 Dr
129
BU
Ha
163
uve
LA
128
NA
1114
atsi
246
3124
746
4.15
4.29.
TAN
4133
1.78
424
CM
FWAY
B
1234
AI
191%
SIN
are
196
1628
DI
2016
329 HKIN
THE
65
in
SUUN
ASS
MA
W
42
5
319
L
TUK IN
En 116
MA
14
www
EP
67
A
14
24244
4018
4.7
47
NA
SUSE
X6IN 6n th
439 19
LAN KIN GA
LA KR
SUFW
Sector
S&P 500
Consumer/Retall
Finance
Heathcare
Industrial / Manufacturing
Media
Technology
Non-Peer Group Comparables
High
Median
Mean
Low
For Illustrative Purposes Only
#ef 2005 P/E 04-05 Rev
Companies Multiple Growth
500 15
8.5%
24
45
11
5
22
17.6x
12.4x
1.5
17.3x
20.2x
17.7x
20.2x
17.7x
17.3x
12.4x
5.6%
6.8%
6.7%
5.9%
6.6%
7.0%
7.0%
6.6%
6.4%
5.6%
2005
LTGR PE/LTGR
10.9%
10.8%
11.2%
11.7%
11.7%
11.2%
11.2%
10.8%
Source: Factset
Note: Non-peer group comparables represent companies with market capitalizations
greater than $1 billion in the S&P 500 or NASDAO that have long term EPS grown
rates between 10.0% and 12.0%
1,6x
1.8x
1,1x
1.7x
1.5x
1.7x
1.6x
1.6x
1.5x
1.1x
30View entire presentation