Vroom Results Presentation Deck
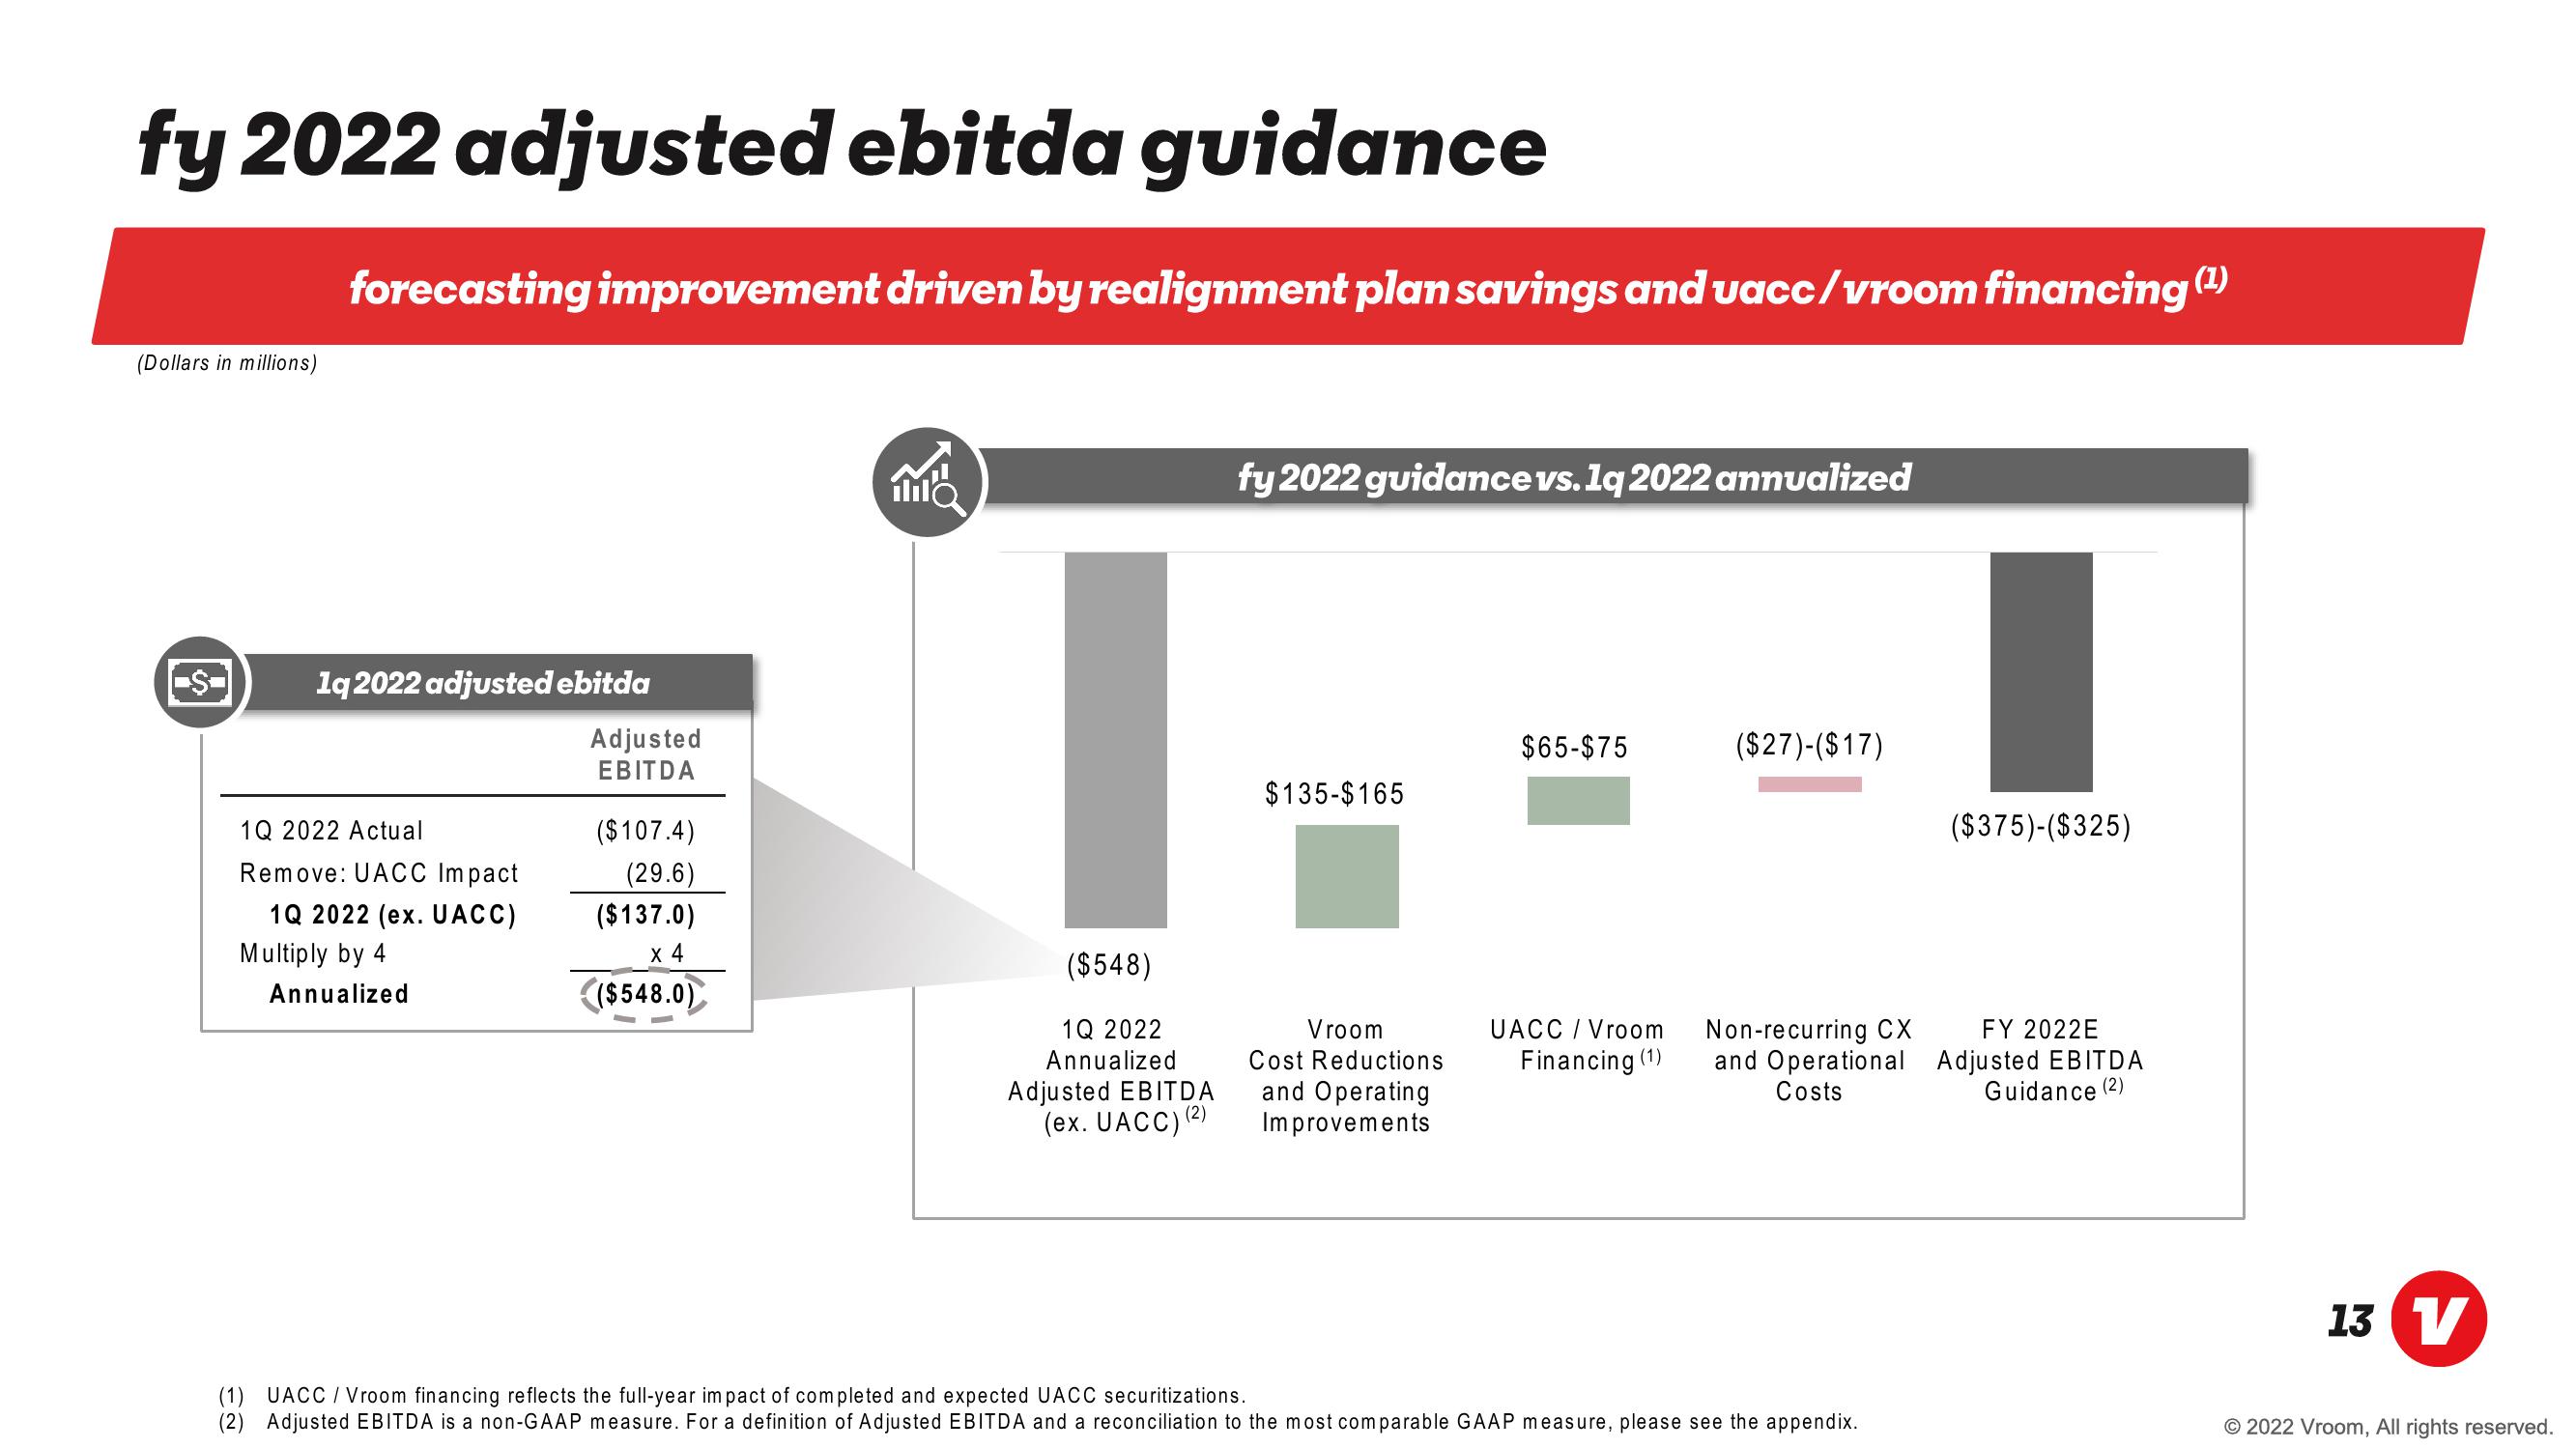
fy 2022 adjusted ebitda guidance
(Dollars in millions)
$
forecasting improvement driven by realignment plan savings and uacc/vroom financing (¹)
1q 2022 adjusted ebitda
1Q 2022 Actual
Remove: UACC Impact
1Q 2022 (ex. UACC)
Multiply by 4
Annualized
Adjusted
EBITDA
($107.4)
(29.6)
($137.0)
x 4
($548.0)
MO
($548)
1Q 2022
Annualized
Adjusted EBITDA
(ex. UACC)
(2)
fy 2022 guidance vs. 1q 2022 annualized
$135-$165
Vroom
Cost Reductions
and Operating
Improvements
$65-$75
UACC / Vroom
Financing (1)
($27)-($17)
($375)-($325)
FY 2022E
Non-recurring CX
and Operational Adjusted EBITDA
Costs
Guidance (2)
(1) UACC / Vroom financing reflects the full-year impact of completed and expected UACC securitizations.
(2) Adjusted EBITDA is a non-GAAP measure. For a definition of Adjusted EBITDA and a reconciliation to the most comparable GAAP measure, please see the appendix.
13 V
© 2022 Vroom, All rights reserved.View entire presentation