Apollo Global Management Mergers and Acquisitions Presentation Deck
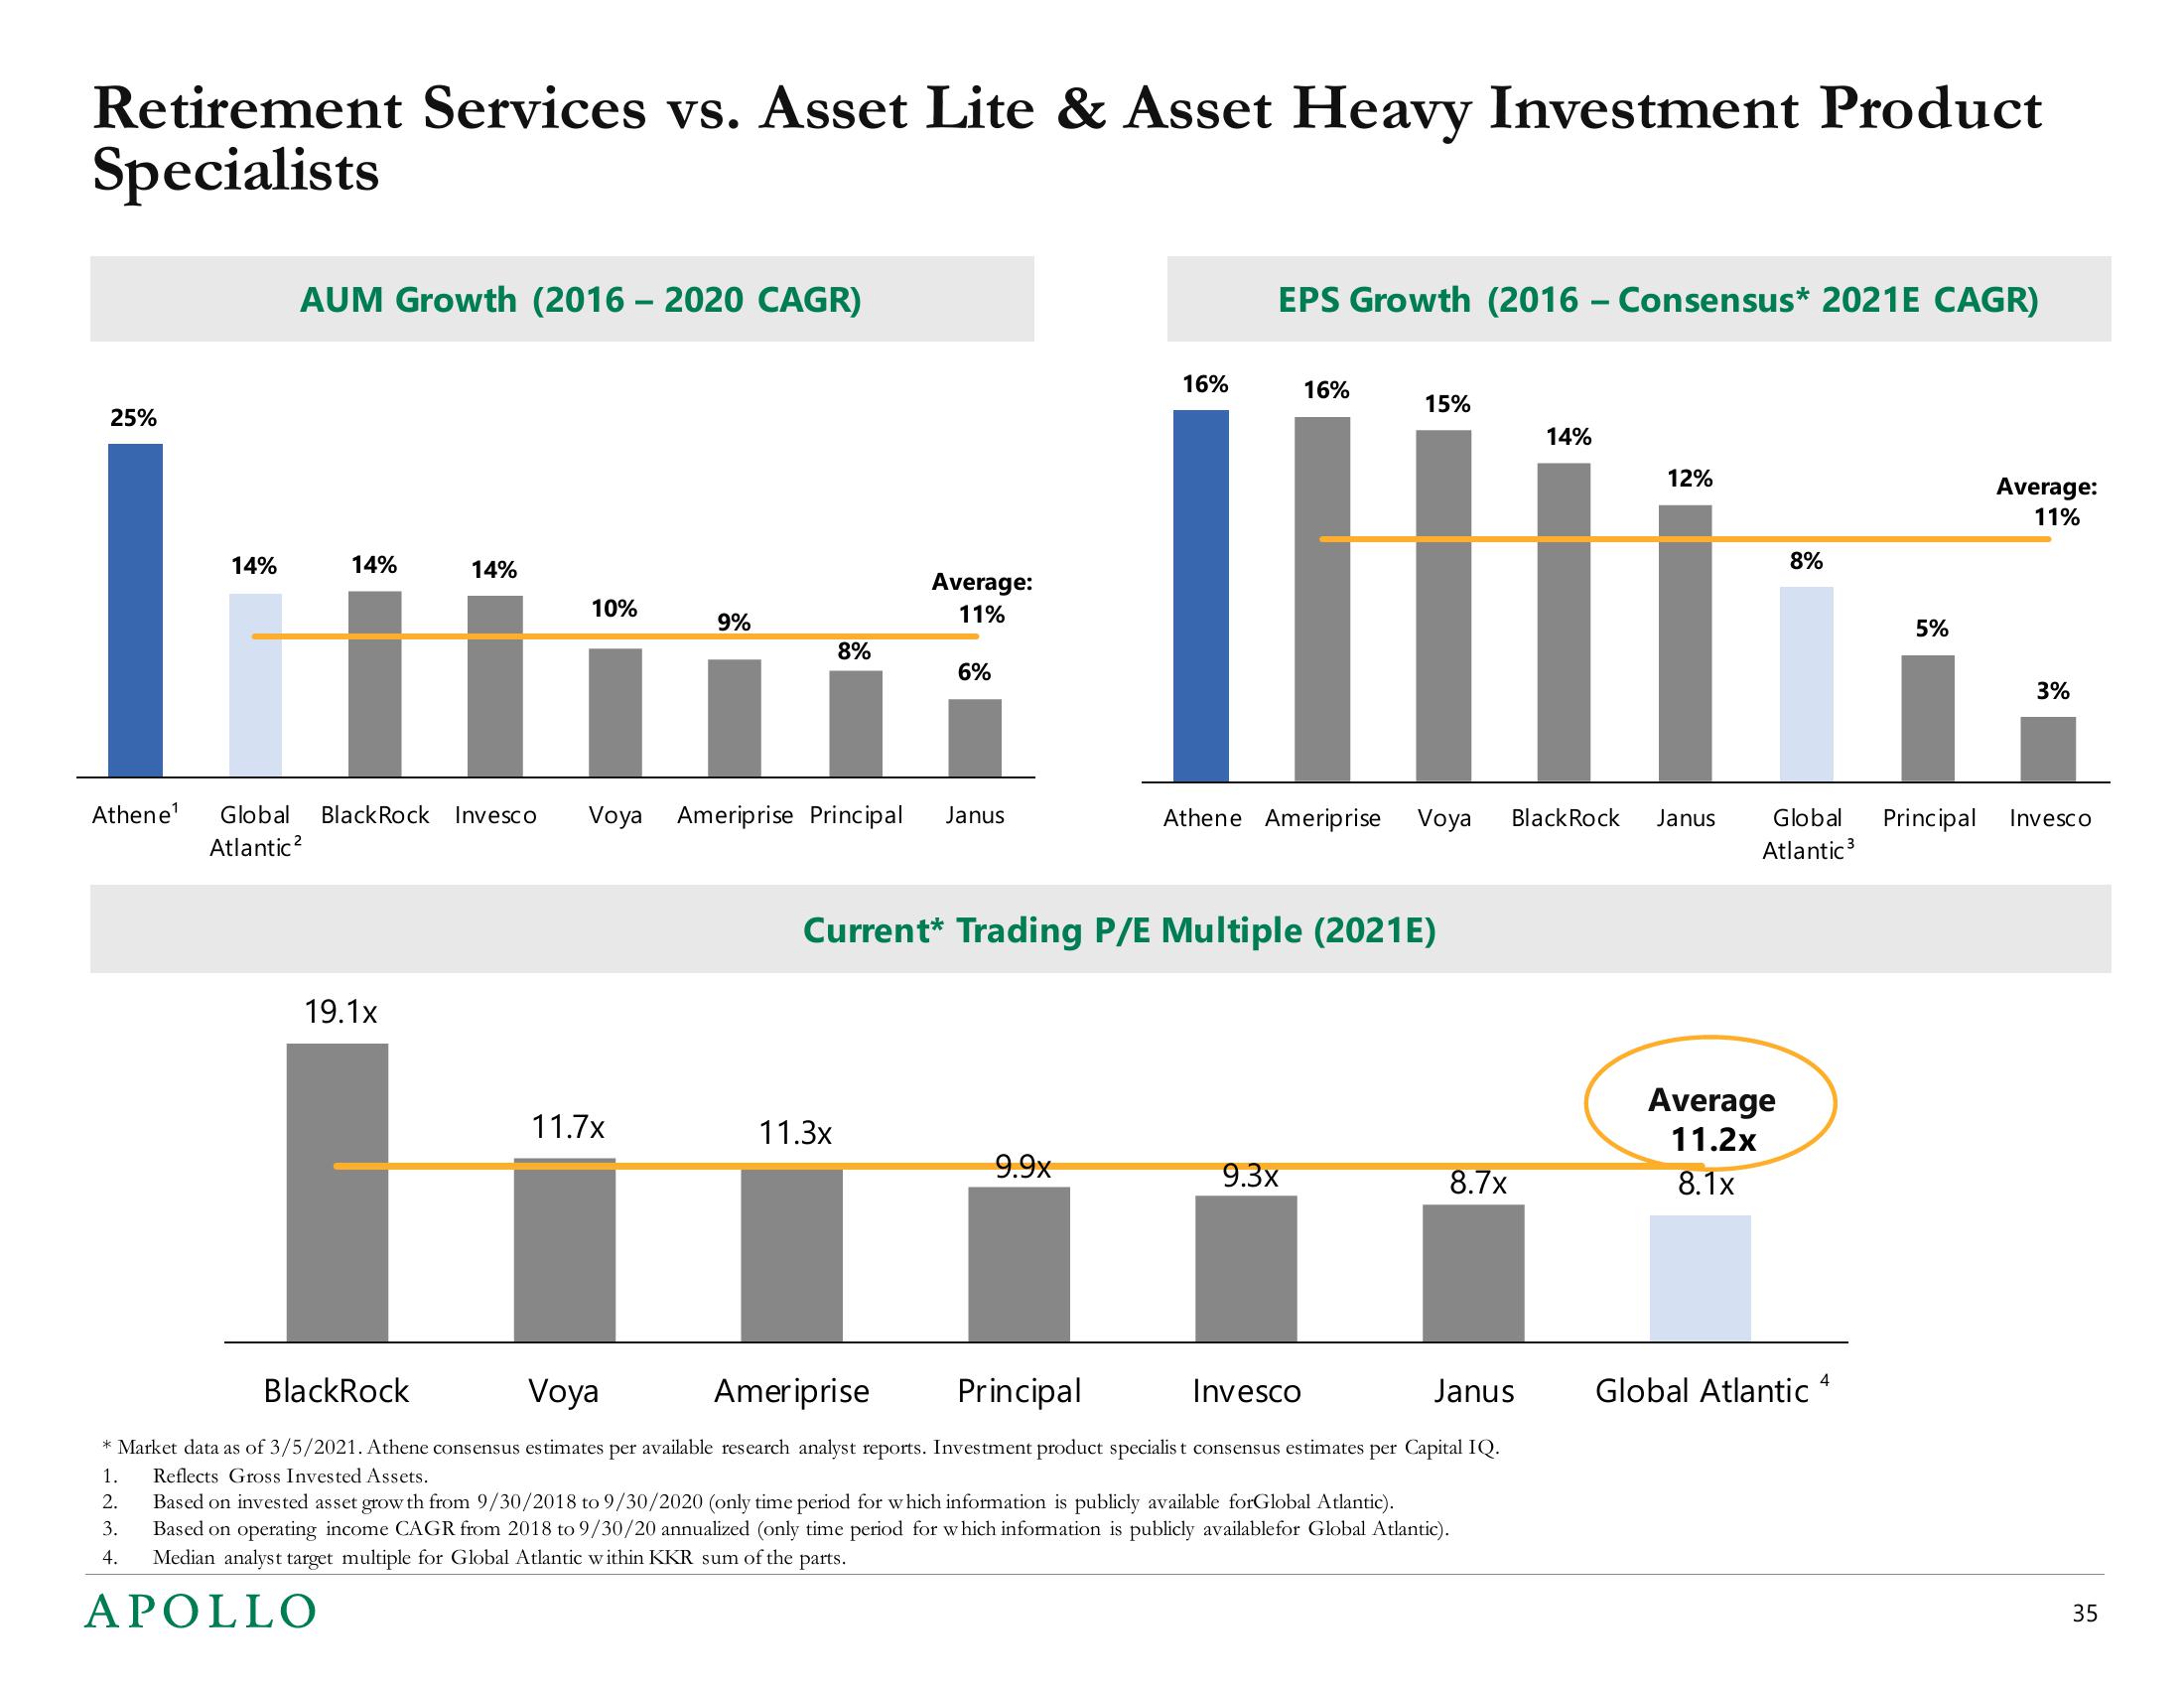
Retirement Services vs. Asset Lite & Asset Heavy Investment Product
Specialists
25%
AUM Growth (2016-2020 CAGR)
14%
||||| سننا
14%
Atlantic²
14%
19.1x
10%
9%
11.7x
Athene¹ Global BlackRock Invesco Voya Ameriprise Principal Janus
8%
Average:
11%
11.3x
6%
EPS Growth (2016 – Consensus* 2021E CAGR)
16%
9.9x
16%
Current* Trading P/E Multiple (2021E)
15%
9.3x
Athene Ameriprise Voya Black Rock Janus
8.7x
BlackRock
Voya
Ameriprise
Principal
Invesco
Janus
* Market data as of 3/5/2021. Athene consensus estimates per available research analyst reports. Investment product specialist consensus estimates per Capital IQ.
Reflects Gross Invested Assets.
1.
2.
3.
4.
14%
Based on invested asset grow th from 9/30/2018 to 9/30/2020 (only time period for which information is publicly available forGlobal Atlantic).
Based on operating income CAGR from 2018 to 9/30/20 annualized (only time period for which information is publicly availablefor Global Atlantic).
Median analyst target multiple for Global Atlantic within KKR sum of the parts.
APOLLO
12%
8%
Average
11.2x
8.1x
Global Principal
Atlantic ³
5%
Global Atlantic 4
Average:
11%
3%
Invesco
35View entire presentation