Kinnevik Results Presentation Deck
Intro
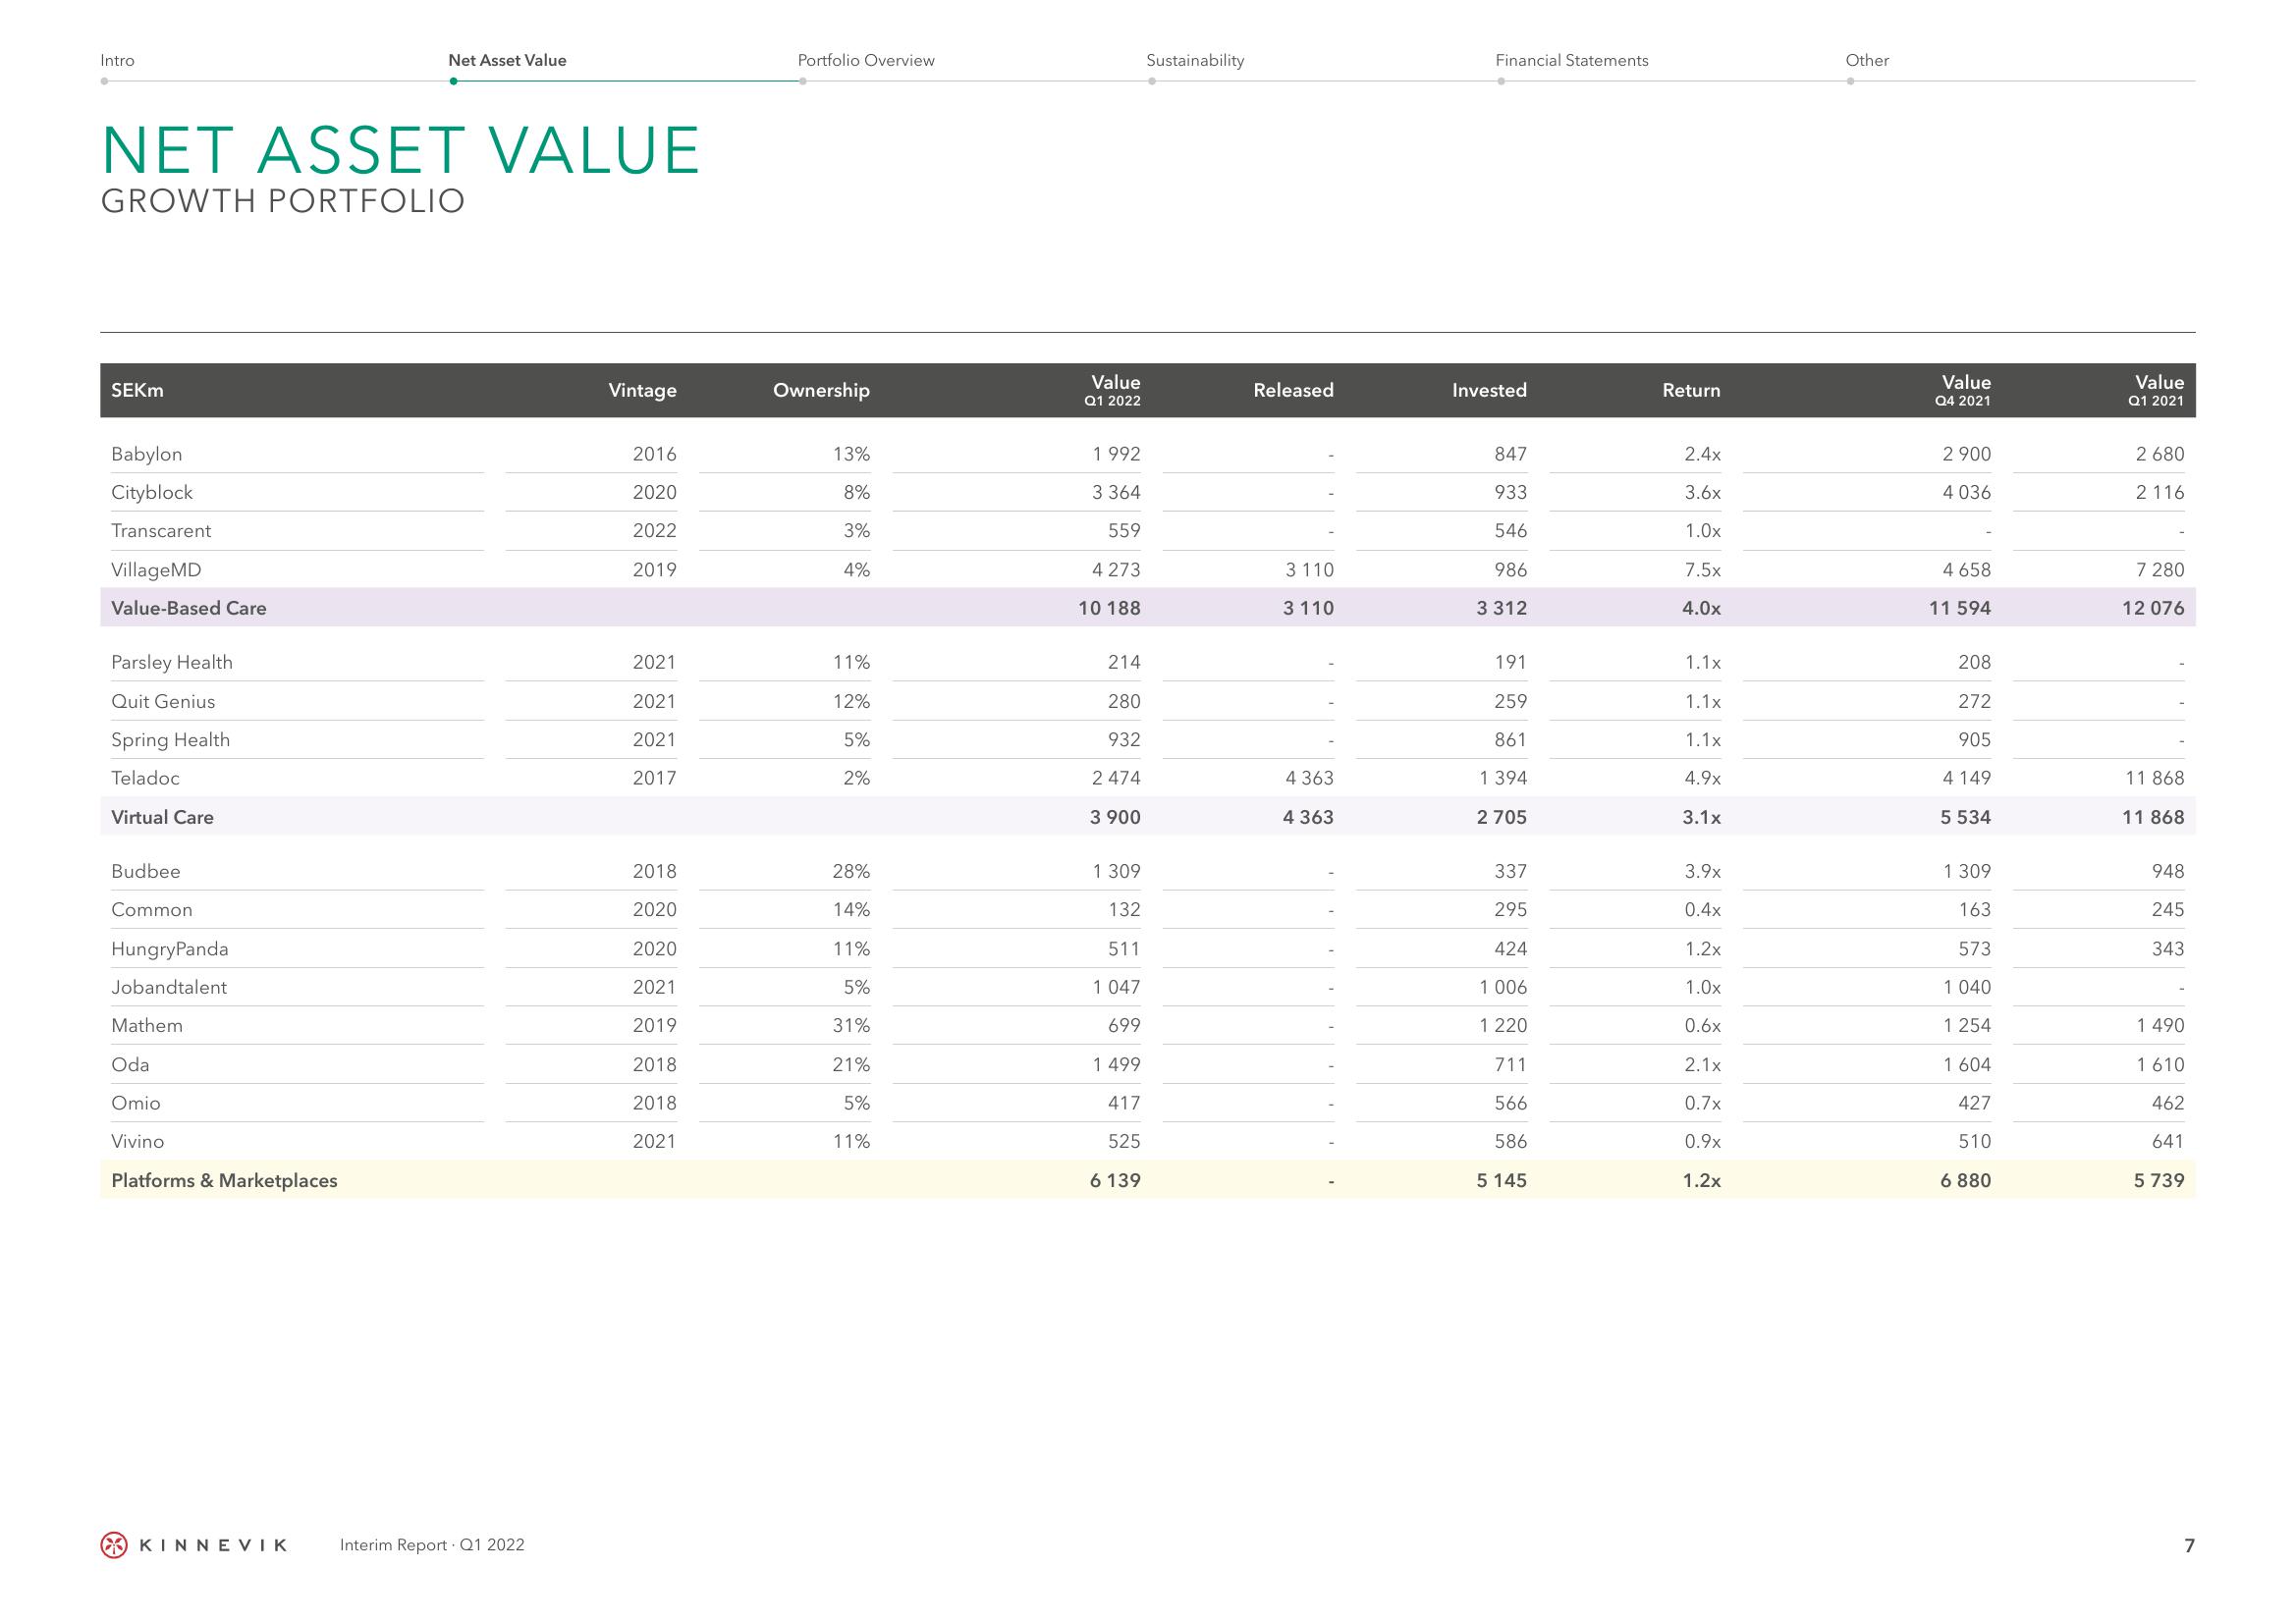
NET ASSET VALUE
GROWTH PORTFOLIO
SEKM
Babylon
Cityblock
Transcarent
Village MD
Value-Based Care
Parsley Health
Quit Genius
Spring Health
Teladoc
Virtual Care
Budbee
Common
HungryPanda
Jobandtalent
Mathem
Oda
Omio
Vivino
Platforms & Marketplaces
Net Asset Value
KINNEVIK
Interim Report Q1 2022
Vintage
2016
2020
2022
2019
2021
2021
2021
2017
2018
2020
2020
2021
2019
2018
2018
2021
Portfolio Overview
Ownership
13%
8%
3%
4%
11%
12%
5%
2%
28%
14%
11%
5%
31%
21%
5%
11%
Value
Q1 2022
1 992
3 364
559
4 273
10 188
214
280
932
2 474
3 900
1 309
132
511
1 047
699
1 499
417
525
6 139
Sustainability
Released
3 110
3 110
4 363
4 363
Financial Statements
Invested
847
933
546
986
3312
191
259
861
1394
2 705
337
295
424
1 006
1 220
711
566
586
5 145
Return
2.4x
3.6x
1.0x
7.5x
4.0x
1.1x
1.1x
1.1x
4.9x
3.1x
3.9x
0.4x
1.2x
1.0x
0.6x
2.1x
0.7x
0.9x
1.2x
Other
Value
Q4 2021
2 90
4 036
4 658
11 594
208
272
905
4 149
5 534
1 309
163
573
1 040
1 254
1 604
427
510
6 880
Value
Q1 2021
2 680
2116
7 280
12 076
11 868
11 868
948
245
343
1 490
1610
462
641
5 739
7View entire presentation