Kering Results Presentation Deck slide image

Kering Results Presentation Deck

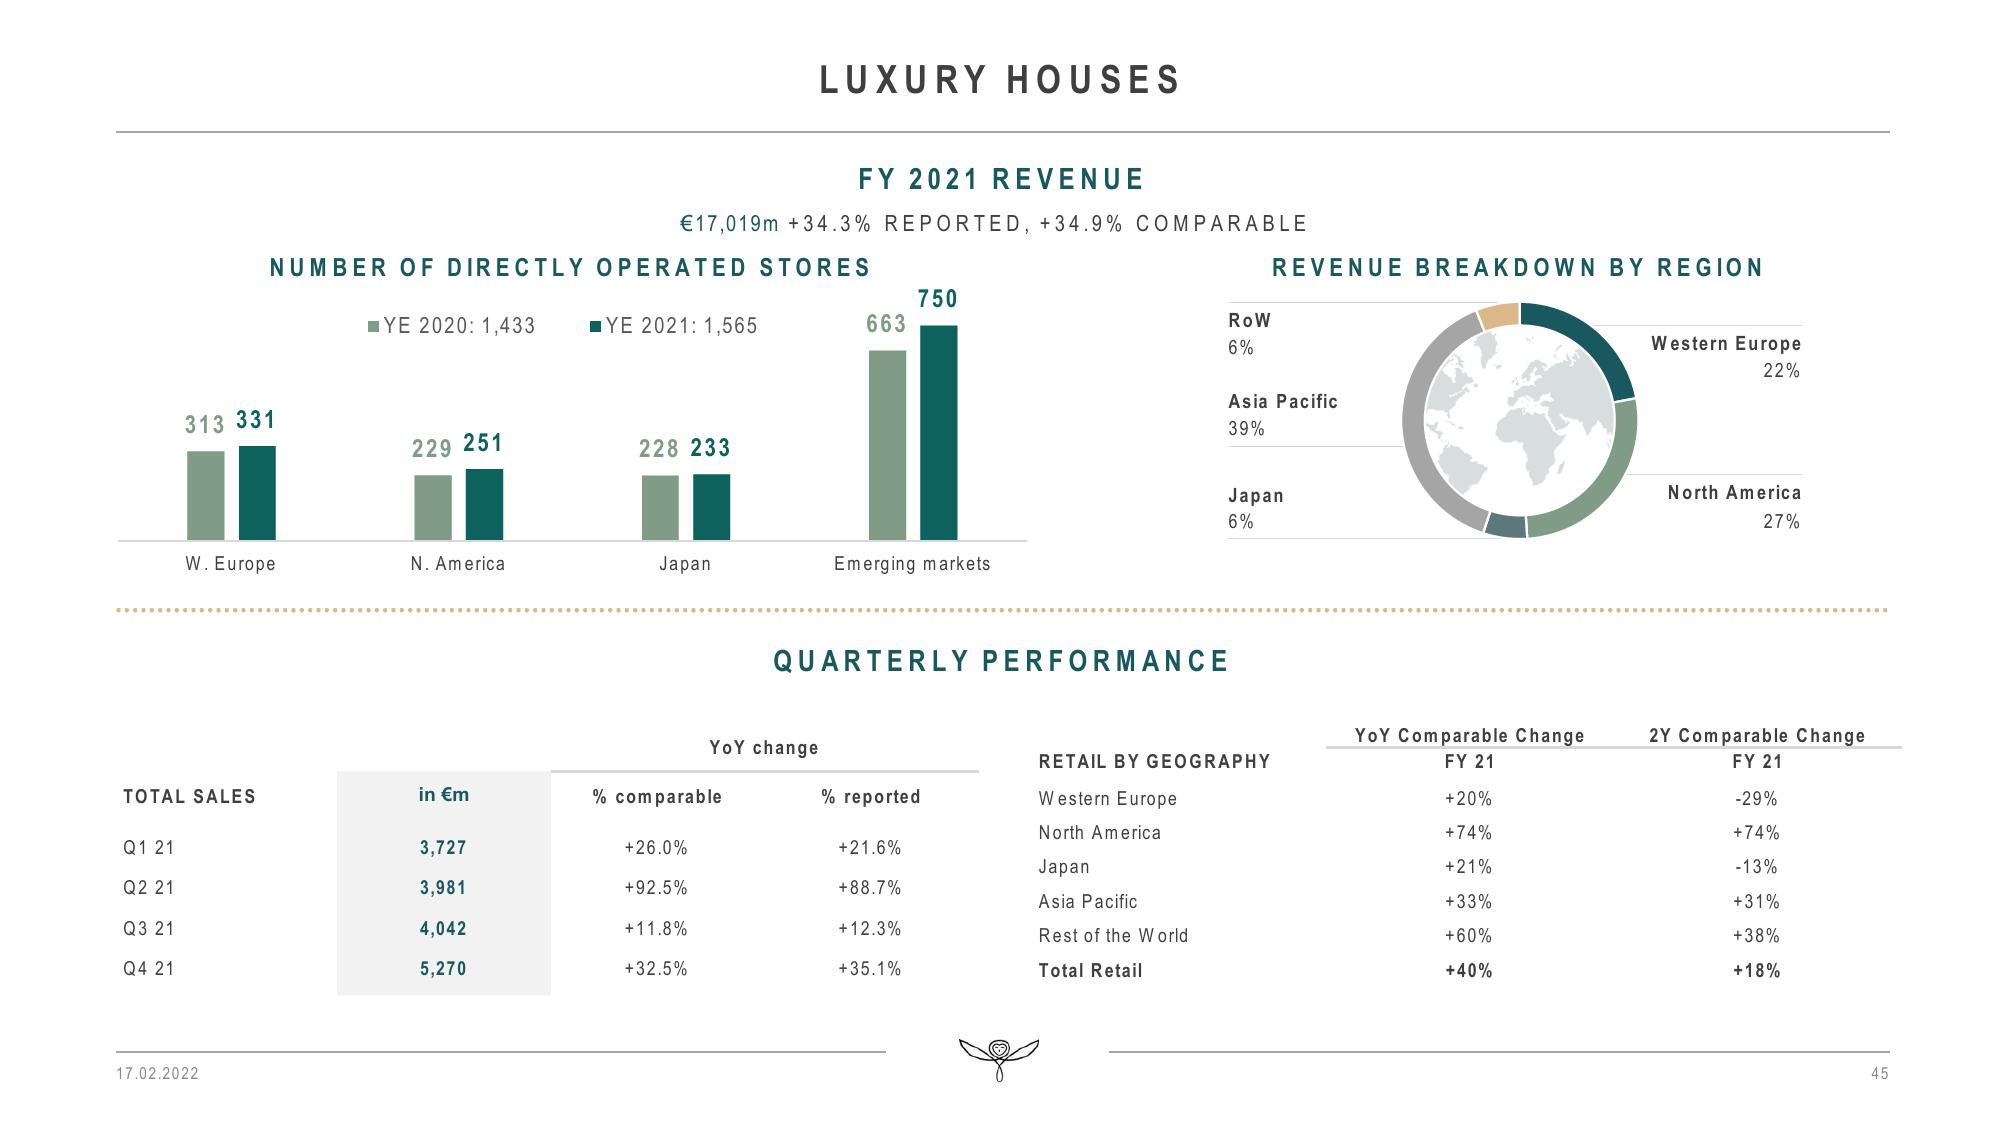
Q1 21 TOTAL SALES Q2 21 Q3 21 Q4 21 313 331 W. Europe FY 2021 REVENUE €17,019m +34.3% REPORTED, +34.9% COMPARABLE NUMBER OF DIRECTLY OPERATED STORES 17.02.2022 ■YE 2020: 1,433 229 251 N. America in €m 3,727 3,981 4,042 5,270 ■YE 2021: 1,565 228 233 Japan % comparable +26.0% +92.5% +11.8% +32.5% LUXURY HOUSES YoY change 663 Emerging markets 750 % reported +21.6% QUARTERLY PERFORMANCE +88.7% + 12.3% +35.1% ROW 6% Japan Asia Pacific Rest of the World Total Retail Asia Pacific 39% REVENUE BREAKDOWN BY REGION Japan 6% RETAIL BY GEOGRAPHY Western Europe North America YoY Comparable Change FY 21 +20% +74% +21% +33% +60% +40% Western Europe 22% North America 27% 2Y Comparable Change FY 21 -29% +74% -13% +31% +38% +18% 45
View entire presentation