Liberty Global Results Presentation Deck
VMO2 JV RECONCILIATIONS - REVENUE
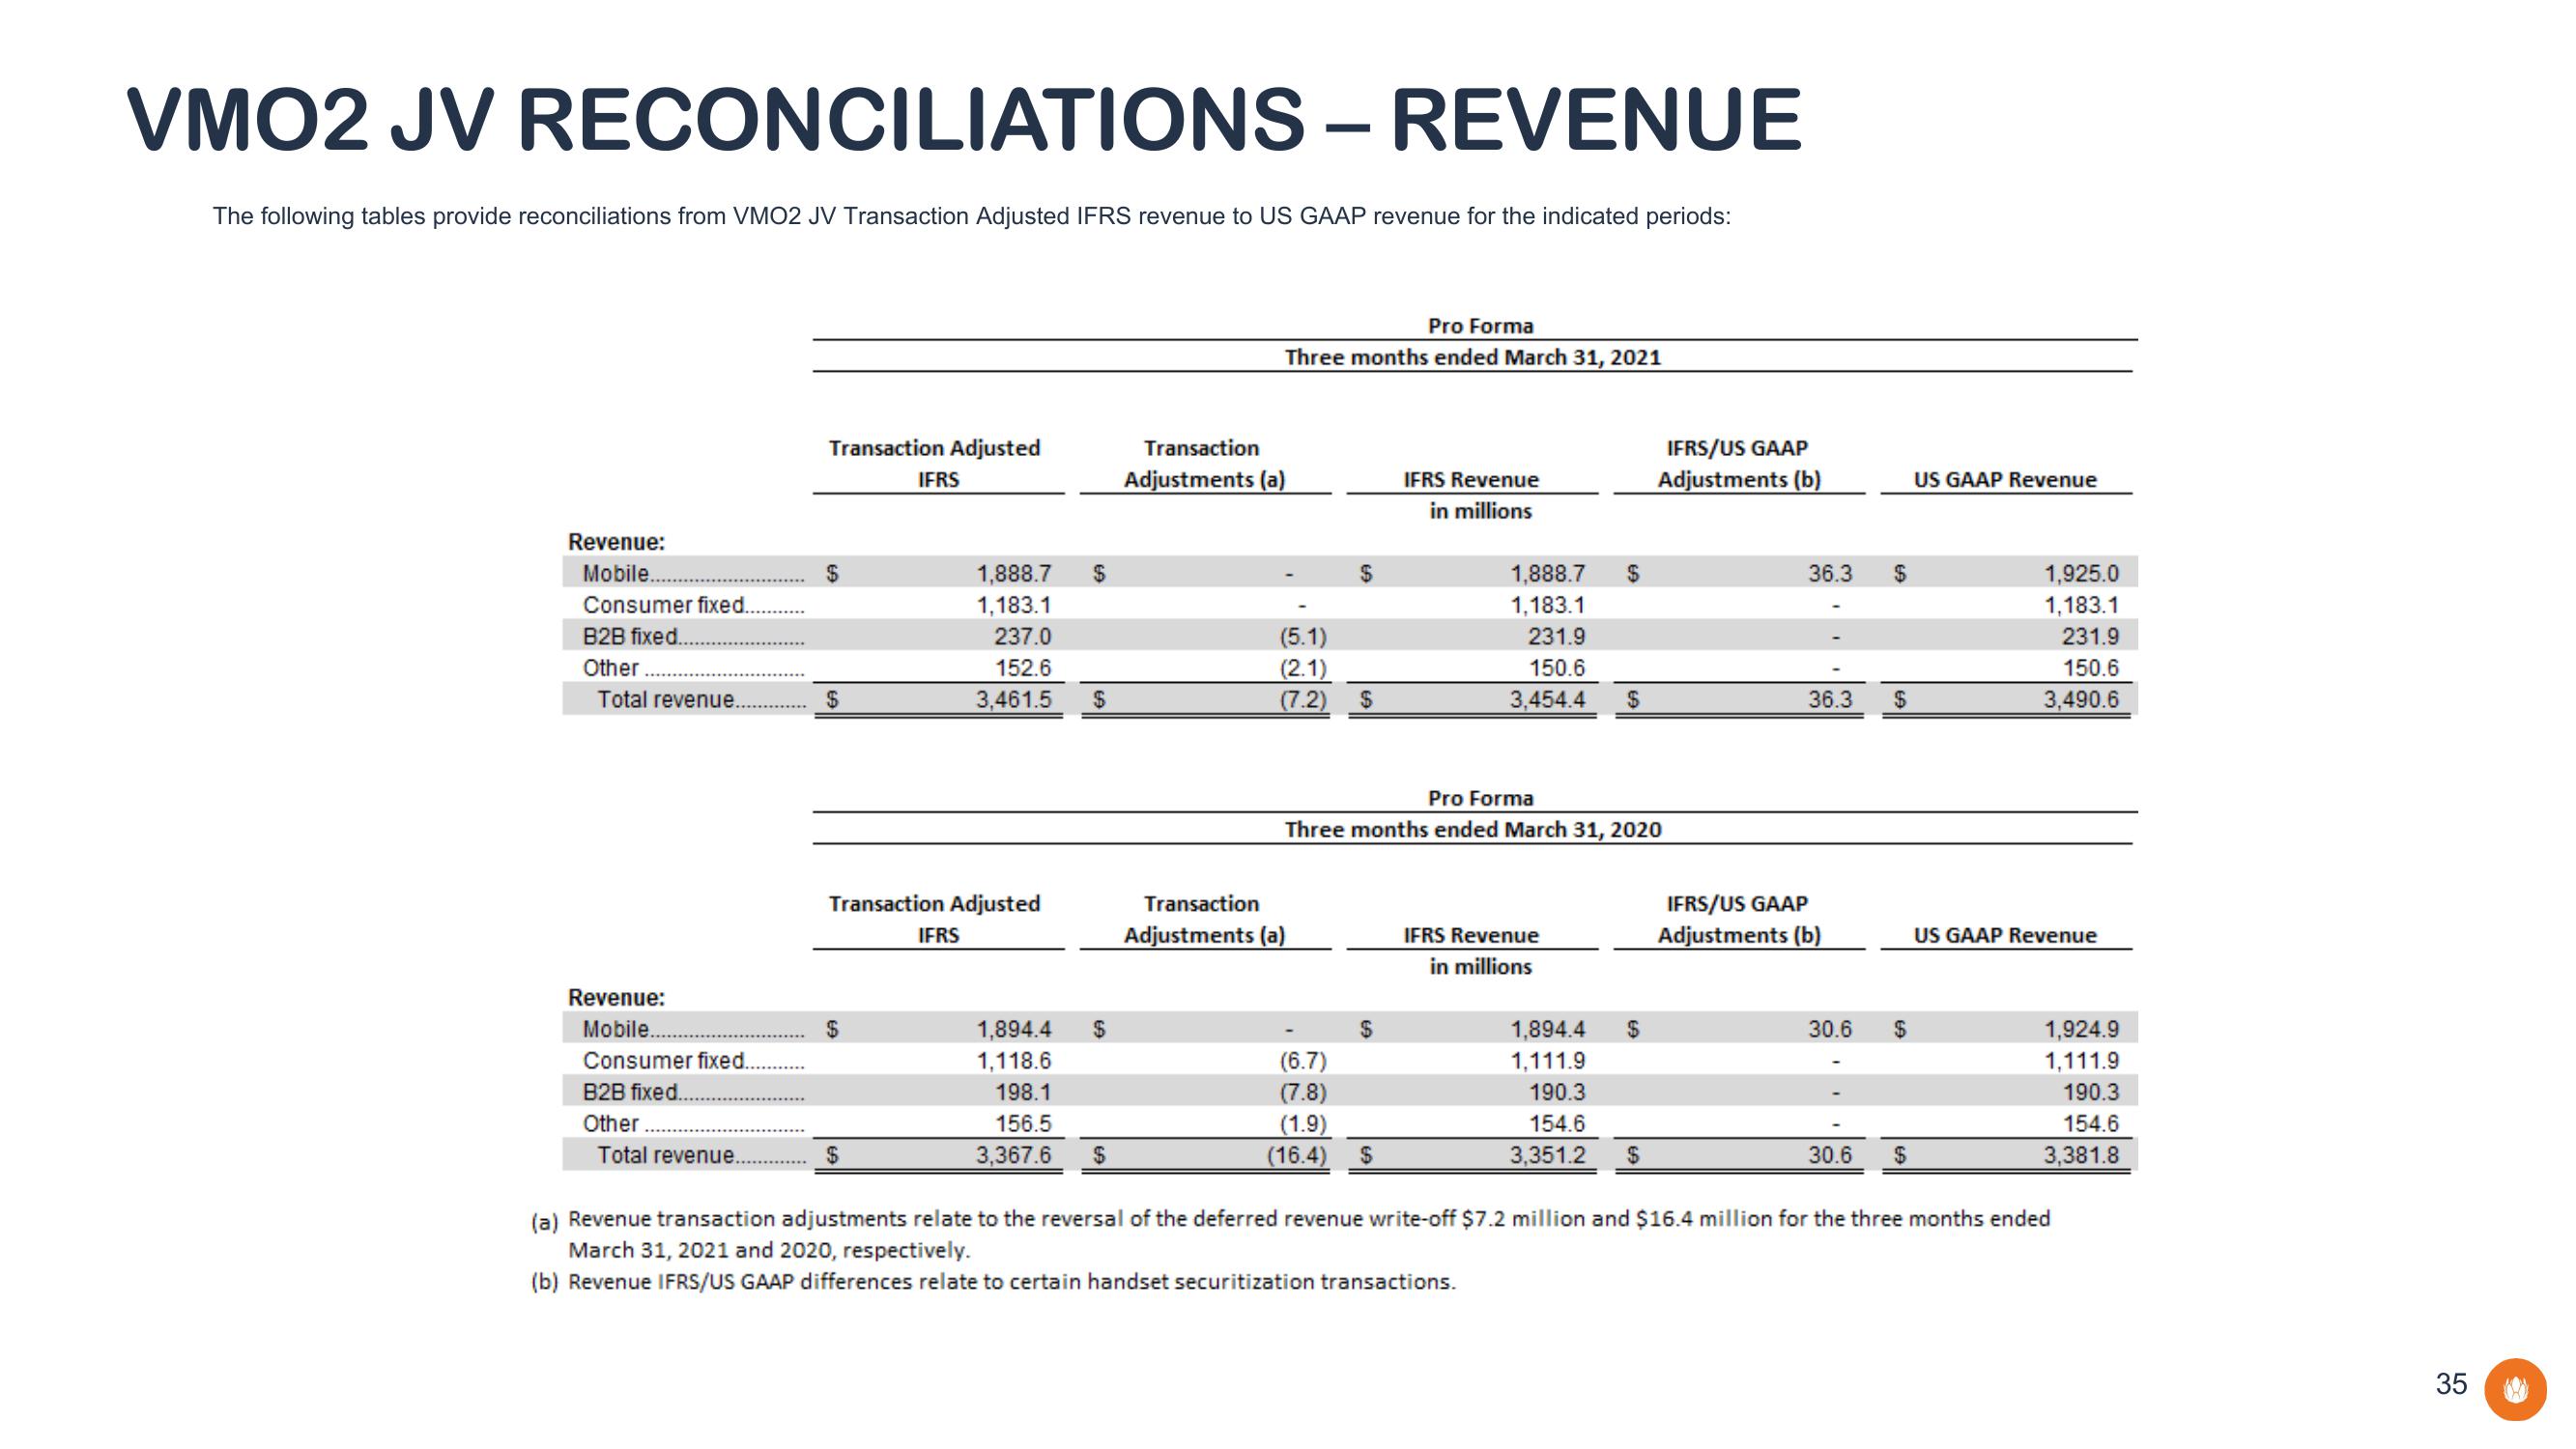
The following tables provide reconciliations from VMO2 JV Transaction Adjusted IFRS revenue to US GAAP revenue for the indicated periods:
Revenue:
Mobile.
Consumer fixed....
B2B fixed.
Other
Total revenue.
Revenue:
Mobile...
Consumer fixed..
B2B fixed.
Other
Total revenue.
Transaction Adjusted
$
$
IFRS
$
1,888.7
1,183.1
Transaction Adjusted
IFRS
237.0
152.6
3,461.5
$
$
1,894.4 $
1,118.6
198.1
156.5
3,367.6 $
Pro Forma
Three months ended March 31, 2021
Transaction
Adjustments (a)
(5.1)
(2.1)
(7.2)
$
Transaction
Adjustments (a)
IFRS Revenue
in millions
(6.7)
(7.8)
(1.9)
(16.4) $
1,888.7
1,183.1
231.9
150.6
3,454.4
Pro Forma
Three months ended March 31, 2020
IFRS Revenue
in millions
$
1,894.4
1,111.9
190.3
154.6
3,351.2
$
$
IFRS/US GAAP
Adjustments (b)
$
36.3
36.3
IFRS/US GAAP
Adjustments (b)
30.6
30.6
$
$
$
$
US GAAP Revenue
1,925.0
1,183.1
231.9
150.6
3,490.6
US GAAP Revenue
1,924.9
1,111.9
190.3
154.6
3,381.8
(a) Revenue transaction adjustments relate to the reversal of the deferred revenue write-off $7.2 million and $16.4 million for the three months ended
March 31, 2021 and 2020, respectively.
(b) Revenue IFRS/US GAAP differences relate to certain handset securitization transactions.
35View entire presentation