BAT Results Presentation Deck
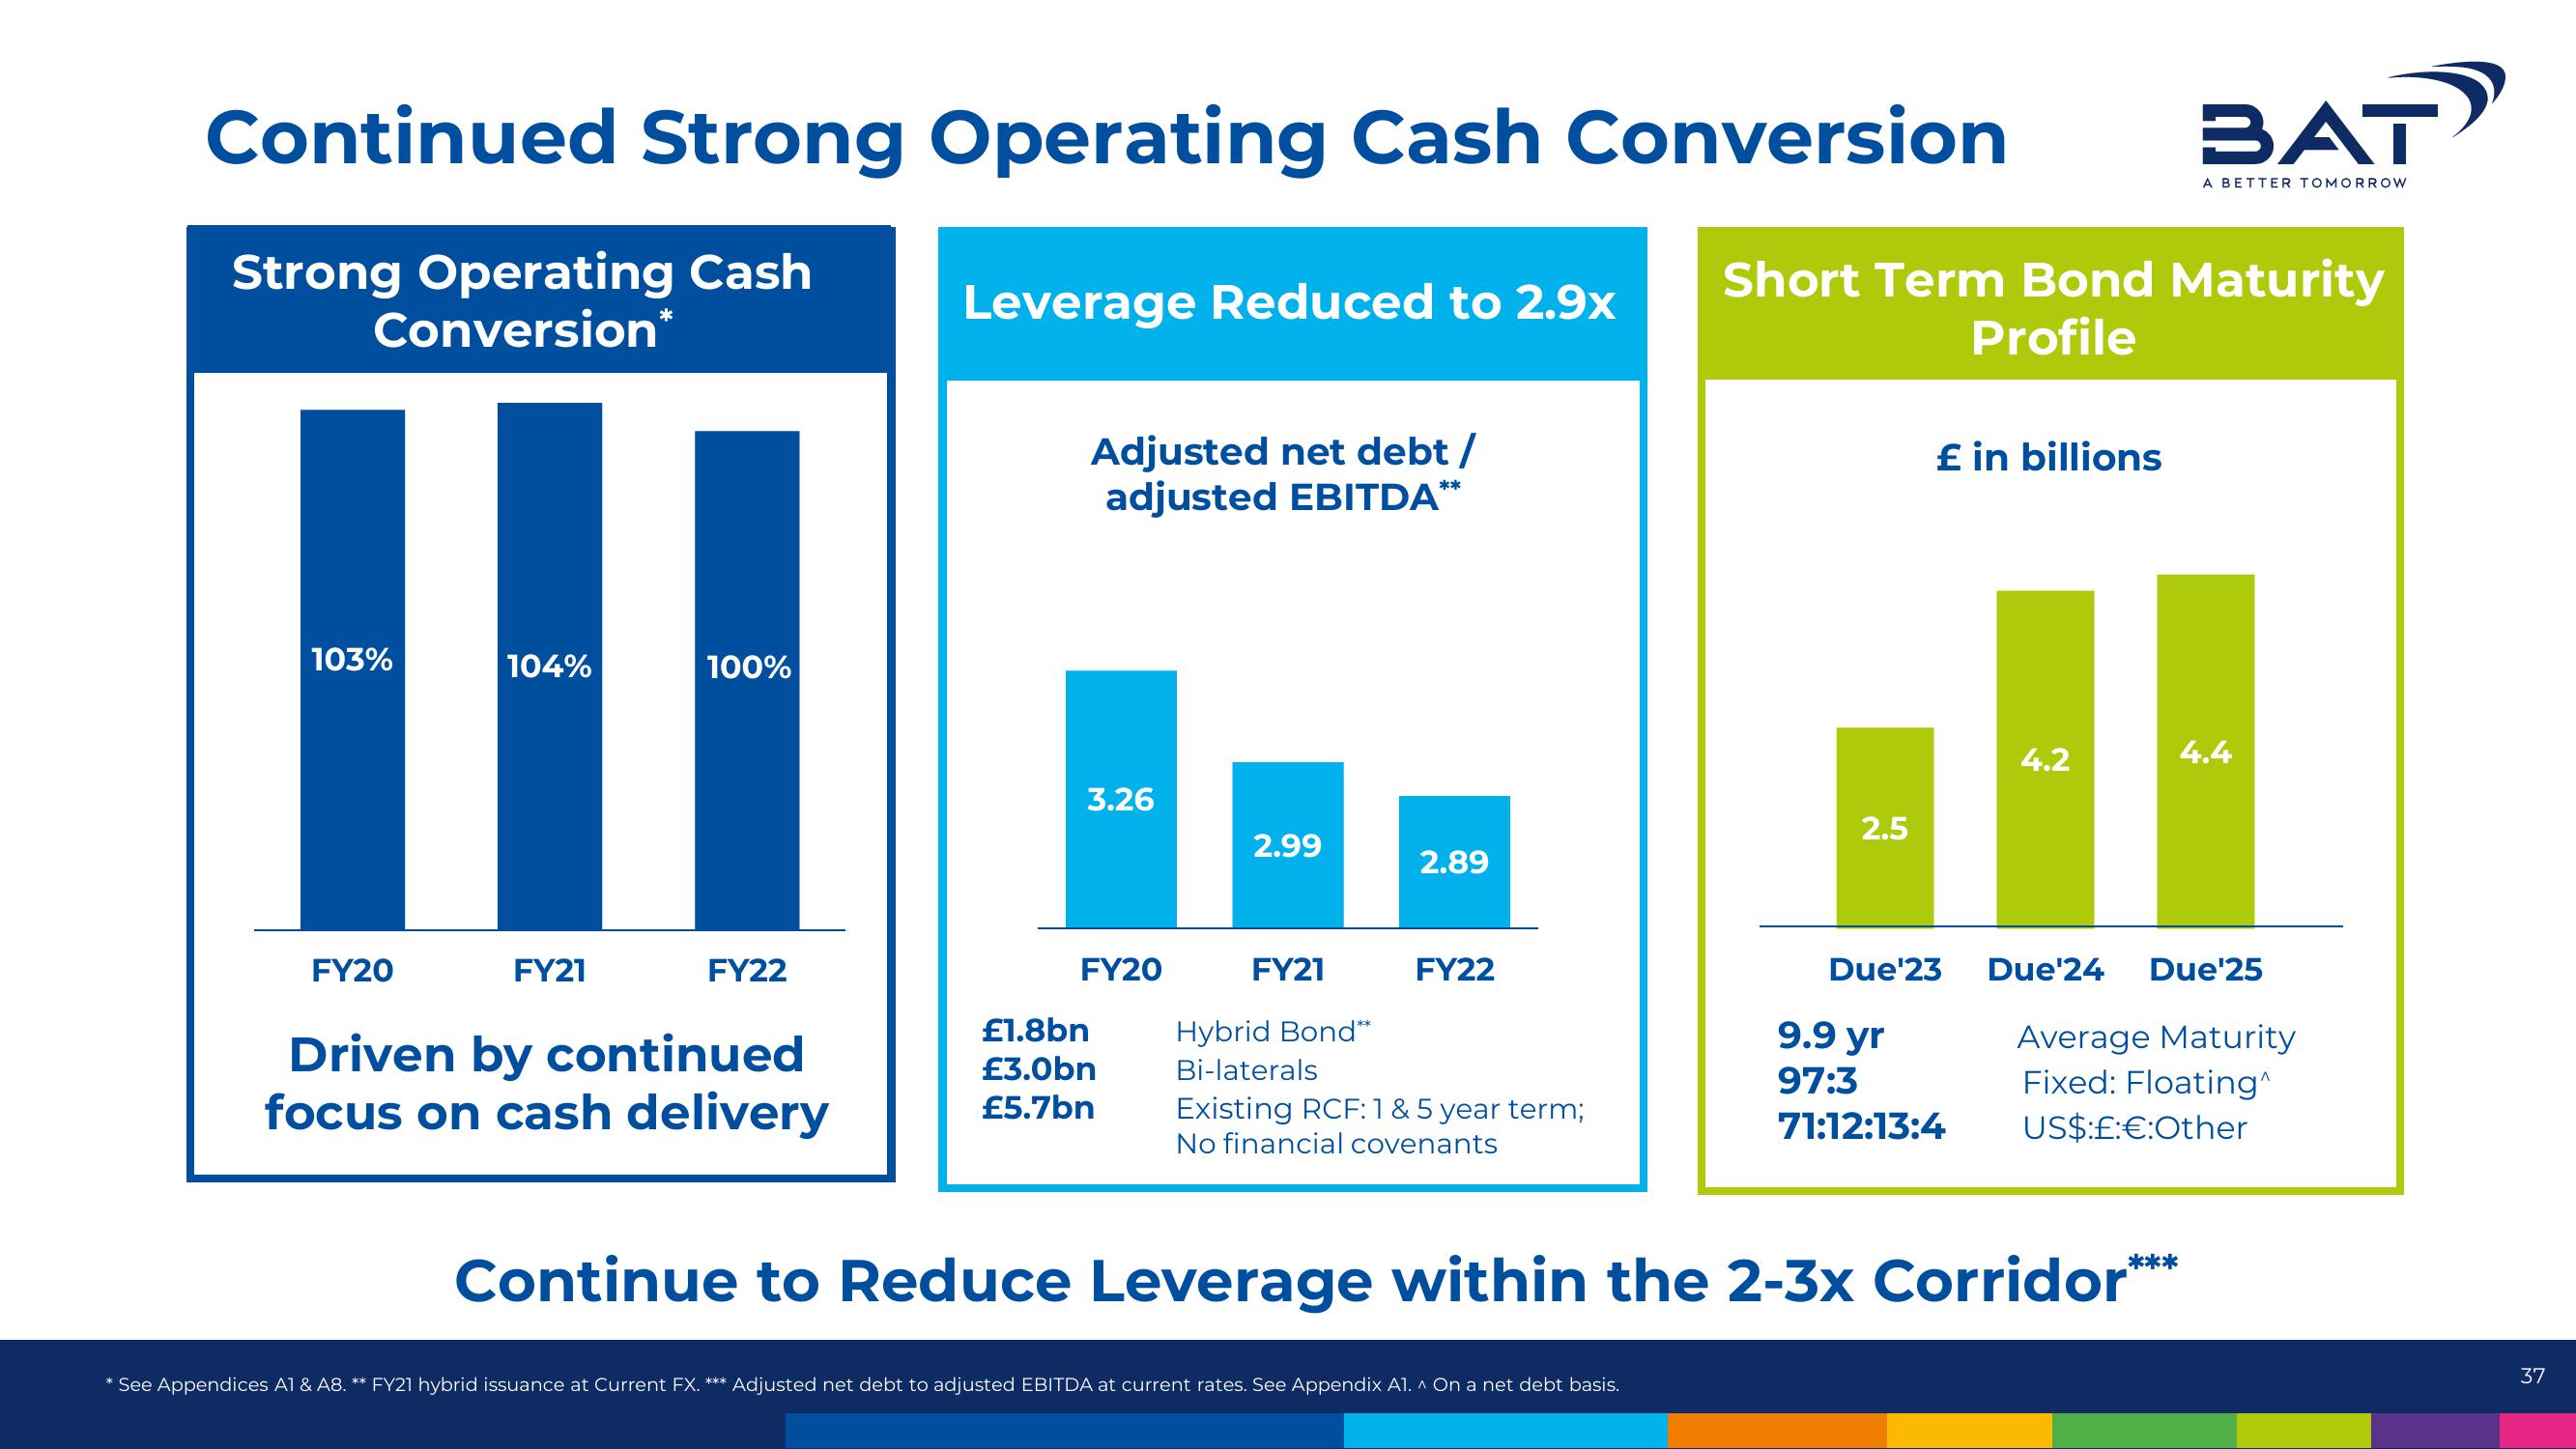
Continued Strong Operating Cash Conversion
Strong Operating Cash
Conversion*
III
103%
104%
100%
FY20
FY21
FY22
Driven by continued
focus on cash delivery
Leverage Reduced to 2.9x
Adjusted net debt /
adjusted EBITDA**
3.26
FY20
£1.8bn
£3.0bn
£5.7bn
2.99
FY21
2.89
FY22
Hybrid Bond**
Bi-laterals
Existing RCF:1 & 5 year term;
No financial covenants
* See Appendices A1 & A8. ** FY21 hybrid issuance at Current FX. *** Adjusted net debt to adjusted EBITDA at current rates. See Appendix A1. ^ On a net debt basis.
Short Term Bond Maturity
Profile
2.5
£ in billions
Due¹23
9.9 yr
97:3
71:12:13:4
4.2
BAT?
A BETTER TOMORROW
Continue to Reduce Leverage within the 2-3x Corridor***
4.4
Due'24 Due¹25
Average Maturity
Fixed: Floating^
US$:£:€:Other
37View entire presentation