OpenText Investor Presentation Deck
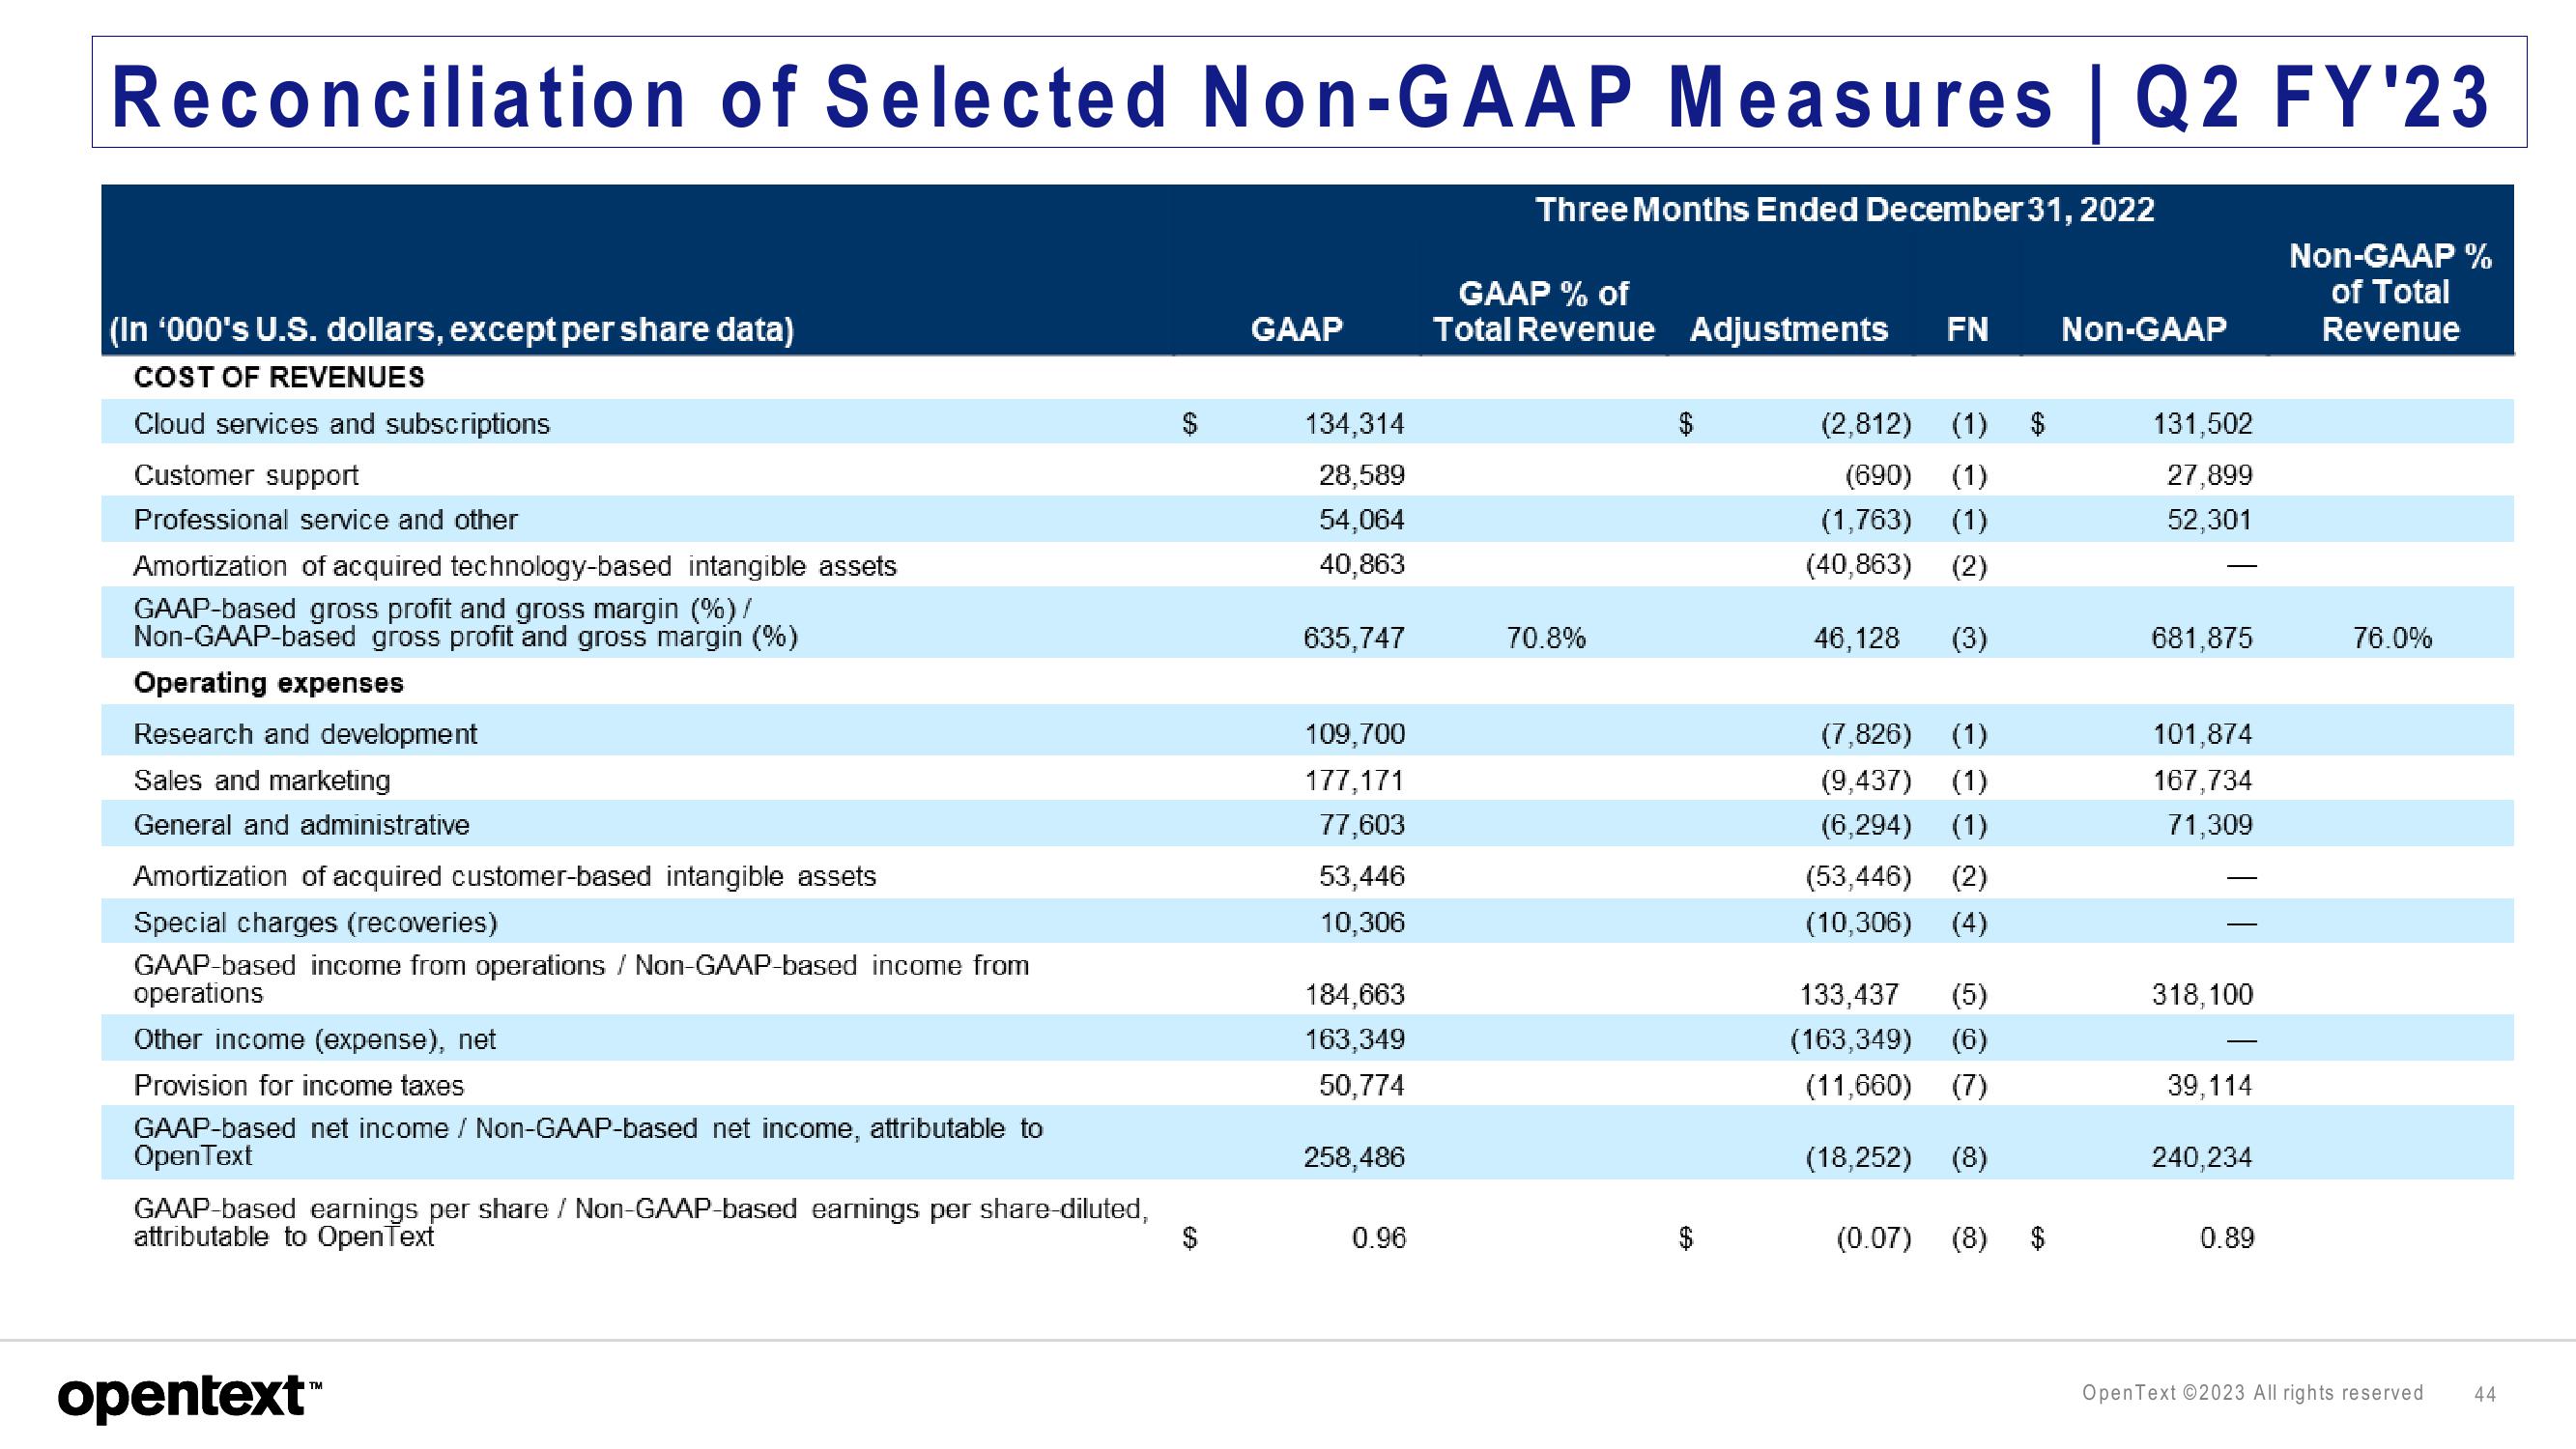
Reconciliation of Selected Non-GAAP Measures | Q2 FY'23
(In '000's U.S. dollars, except per share data)
COST OF REVENUES
Cloud services and subscriptions
Customer support
Professional service and other
Amortization of acquired technology-based intangible assets
GAAP-based gross profit and gross margin (%)/
Non-GAAP-based gross profit and gross margin (%)
Operating expenses
Research and development
Sales and marketing
General and administrative
Amortization of acquired customer-based intangible assets
Special charges (recoveries)
GAAP-based income from operations / Non-GAAP-based income from
operations
Other income (expense), net
Provision for income taxes
GAAP-based net income / Non-GAAP-based net income, attributable to
OpenText
GAAP-based earnings per share / Non-GAAP-based earnings per share-diluted,
attributable to OpenText
opentext™
69
GAAP
134,314
28,589
54,064
40,863
635,747
109,700
177,171
77,603
53,446
10,306
184,663
163,349
50,774
258,486
0.96
Three Months Ended December 31, 2022
GAAP % of
Total Revenue Adjustments FN
70.8%
GA
(2,812) (1)
(690) (1)
(1,763) (1)
(40,863) (2)
46,128
(3)
(7,826) (1)
(9,437) (1)
(6,294) (1)
(53,446) (2)
(10,306) (4)
133,437 (5)
(163,349) (6)
(11,660) (7)
(18,252) (8)
(0.07) (8)
Non-GAAP
131,502
27,899
52,301
681,875
101,874
167,734
71,309
318,100
39,114
240,234
0.89
Non-GAAP %
of Total
Revenue
76.0%
OpenText ©2023 All rights reserved
44View entire presentation