WeWork Results Presentation Deck
Q3 2021 financial results
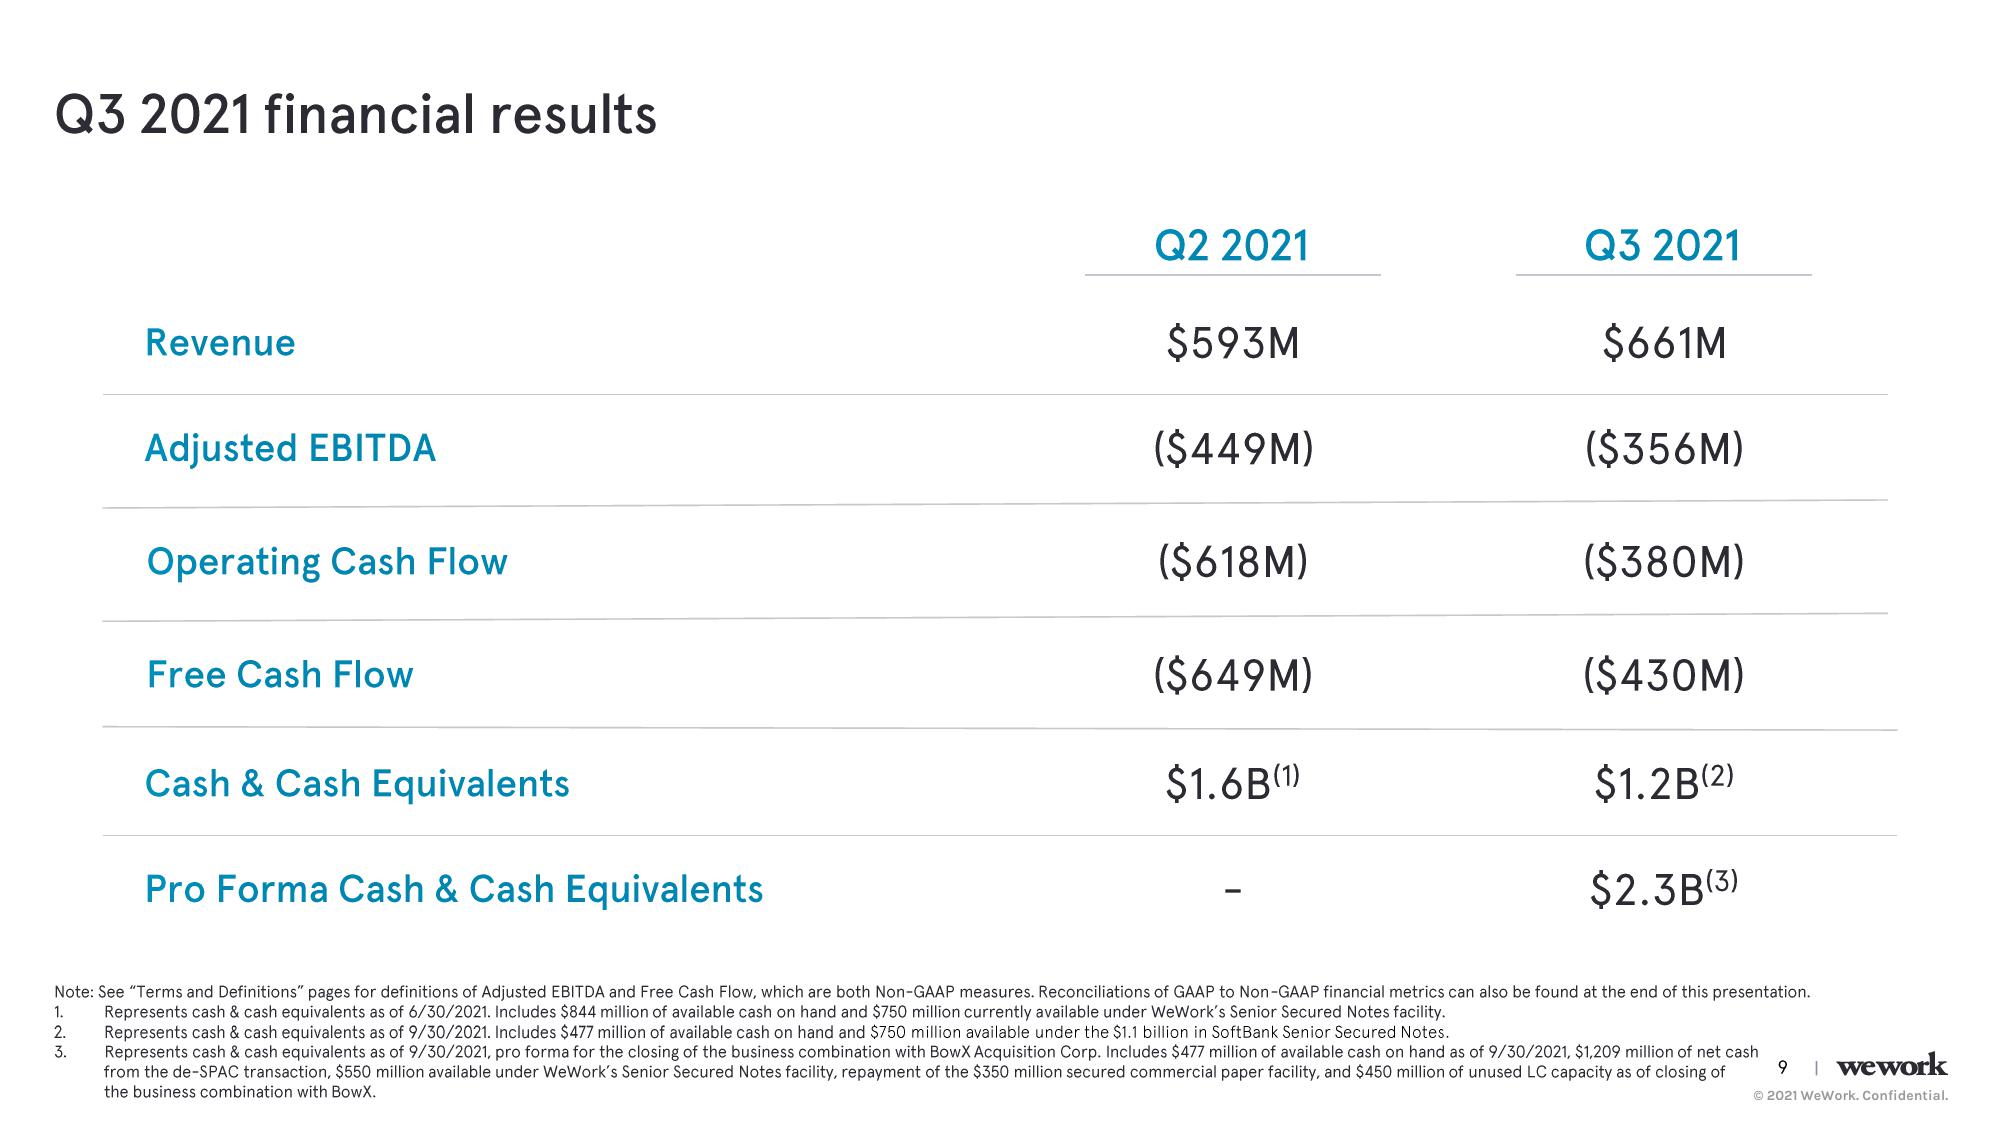
Revenue
1.
2.
3.
Adjusted EBITDA
Operating Cash Flow
Free Cash Flow
Cash & Cash Equivalents
Pro Forma Cash & Cash Equivalents
Q2 2021
$593M
($449M)
($618M)
($649M)
$1.6B (1)
Q3 2021
$661M
($356M)
($380M)
($430M)
$1.2B(2)
$2.3B(3)
Note: See "Terms and Definitions" pages for definitions of Adjusted EBITDA and Free Cash Flow, which are both Non-GAAP measures. Reconciliations of GAAP to Non-GAAP financial metrics can also be found at the end of this presentation.
Represents cash & cash equivalents as of 6/30/2021. Includes $844 million of available cash on hand and $750 million currently available under WeWork's Senior Secured Notes facility.
Represents cash & cash equivalents as of 9/30/2021. Includes $477 million of available cash on hand and $750 million available under the $1.1 billion in SoftBank Senior Secured Notes.
Represents cash & cash equivalents as of 9/30/2021, pro forma for the closing of the business combination with BowX Acquisition Corp. Includes $477 million of available cash on hand as of 9/30/2021, $1,209 million of net cash
from the de-SPAC transaction, $550 million available under WeWork's Senior Secured Notes facility, repayment of the $350 million secured commercial paper facility, and $450 million of unused LC capacity as of closing of
the business combination with BowX.
9
wework
Ⓒ2021 WeWork. Confidential.View entire presentation