Paysafe Results Presentation Deck
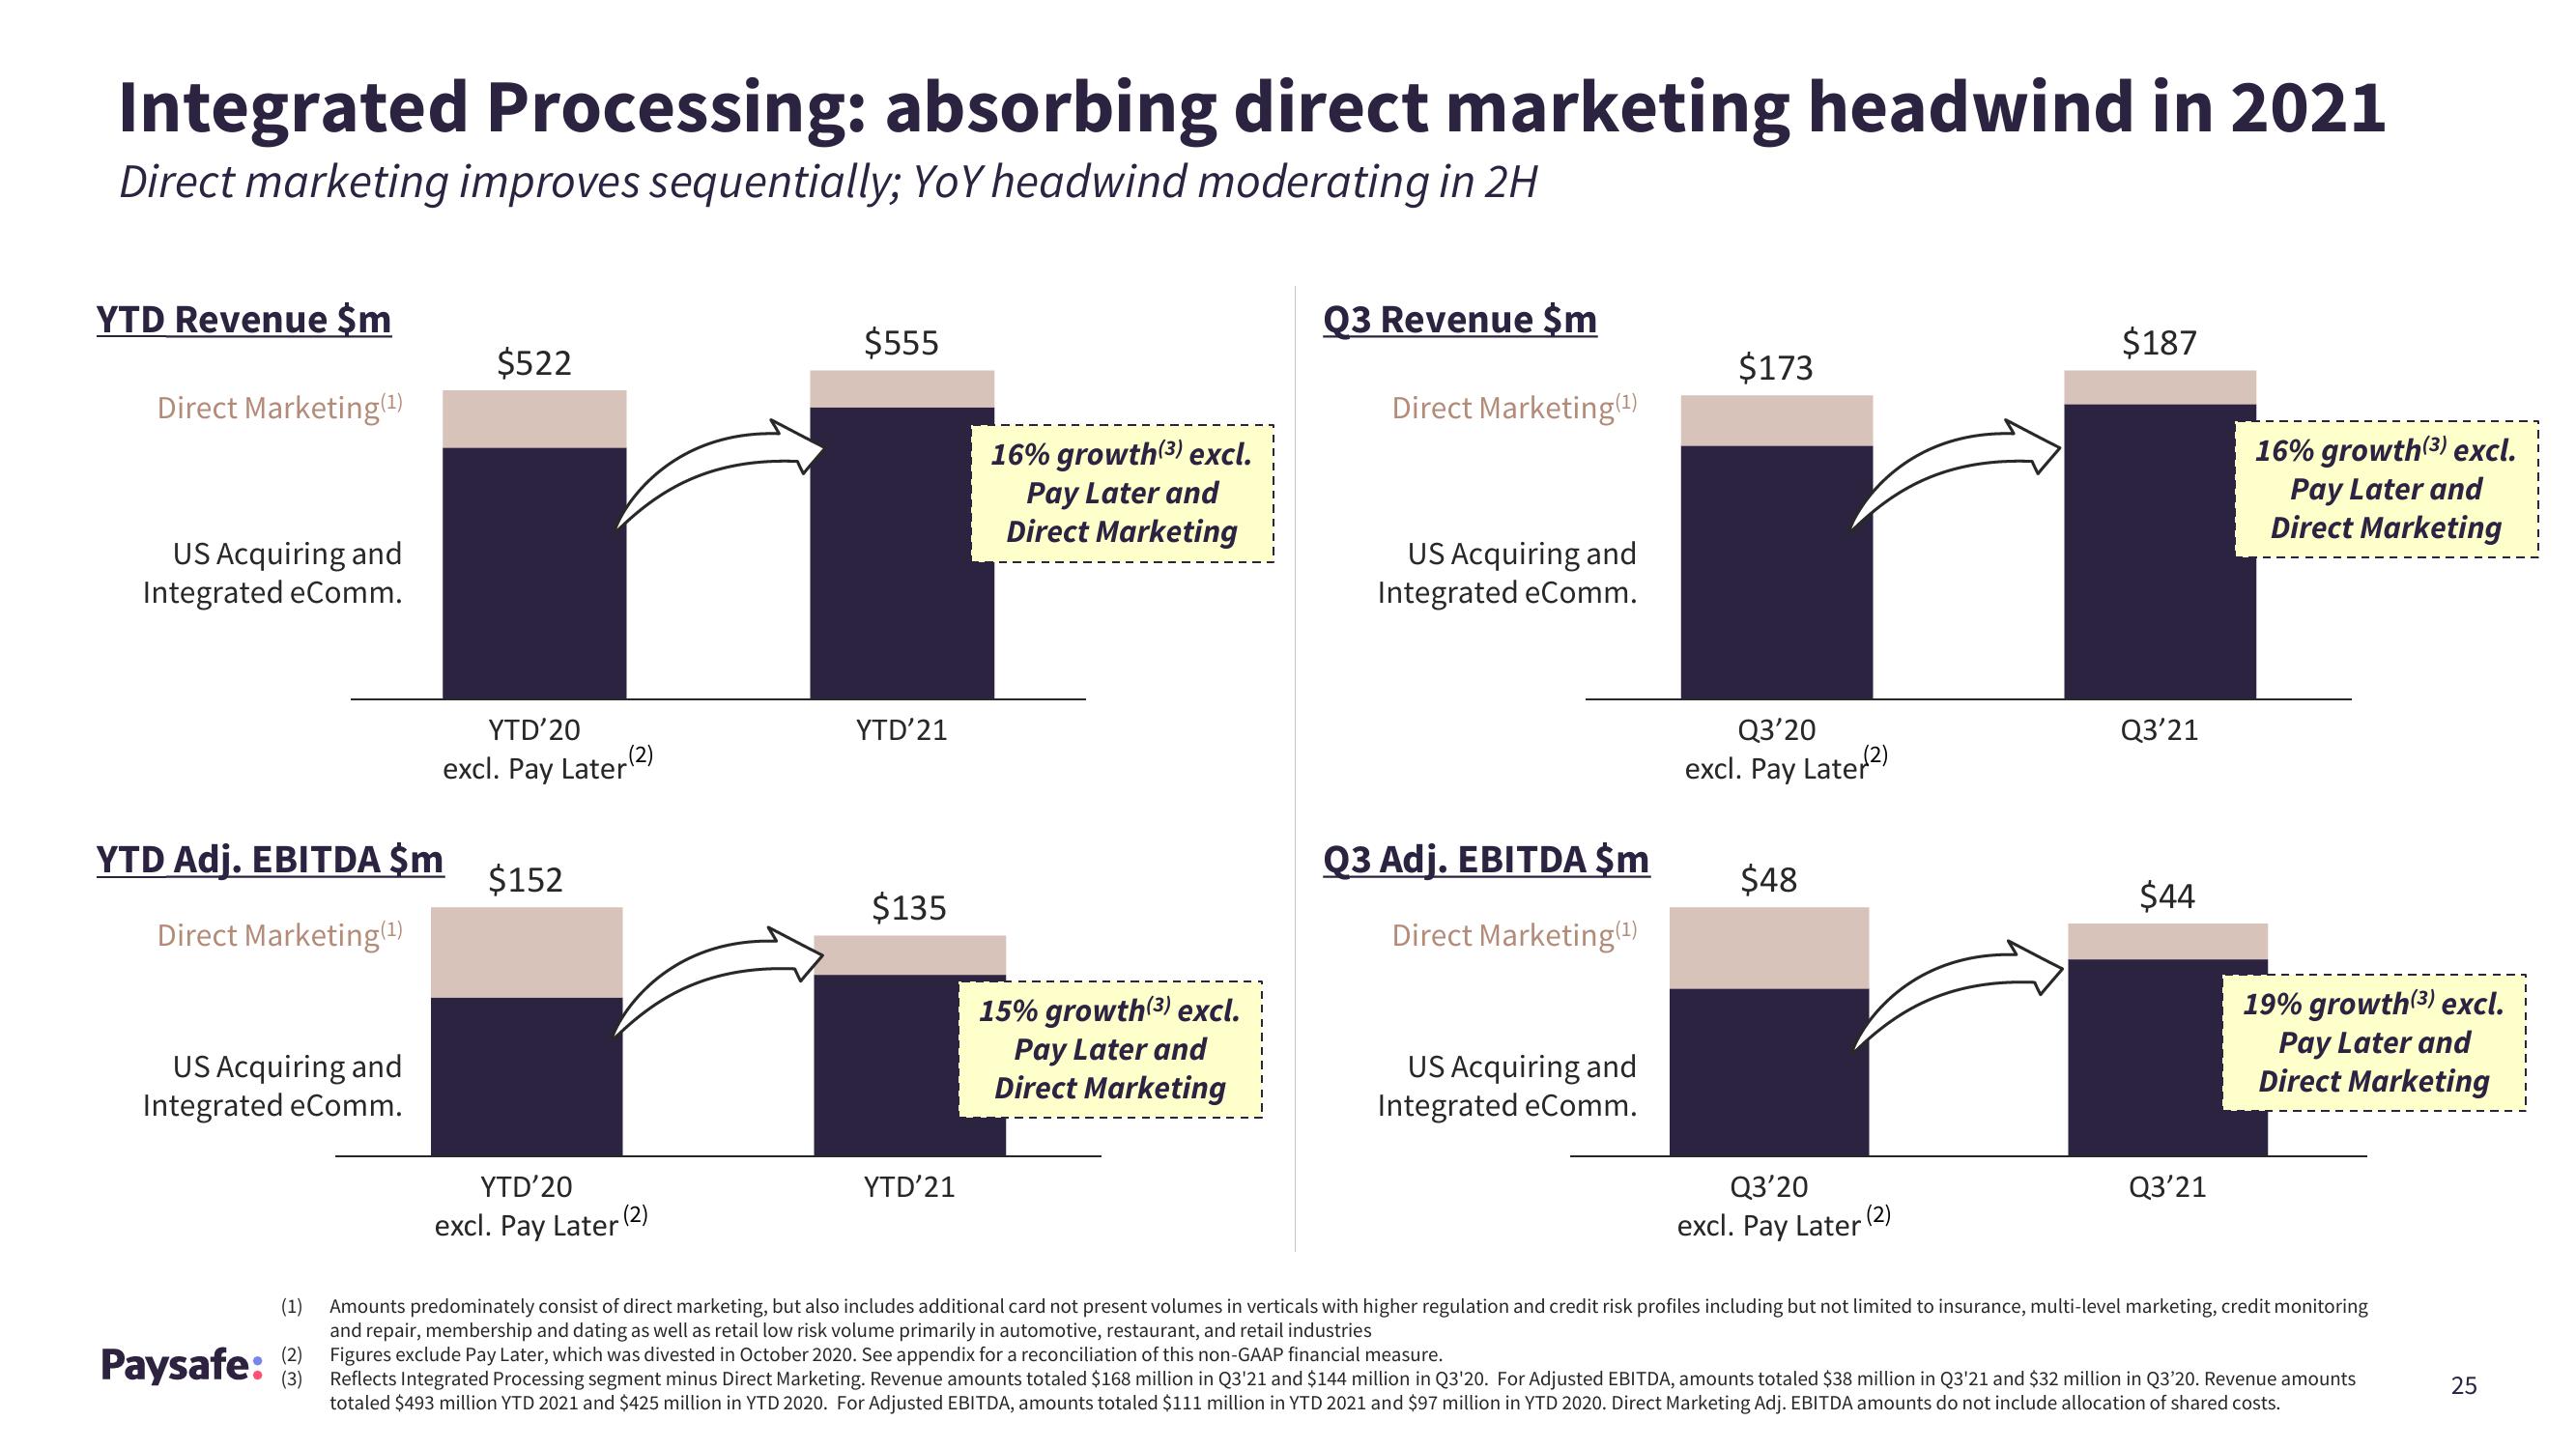
Integrated Processing: absorbing direct marketing headwind in 2021
Direct marketing improves sequentially; YoY headwind moderating in 2H
YTD Revenue $m
Direct Marketing (¹)
US Acquiring and
Integrated eComm.
YTD Adj. EBITDA $m
Direct Marketing (¹)
US Acquiring and
Integrated eComm.
Paysafe:
(1)
(2)
(3)
$522
YTD'20
excl. Pay Later
$152
YTD'20
excl. Pay Later
(2)
(2)
$555
YTD'21
$135
YTD'21
16% growth(3) excl.
Pay Later and
Direct Marketing
15% growth(3) excl.
Pay Later and
Direct Marketing
Q3 Revenue $m
Direct Marketing(¹)
US Acquiring and
Integrated eComm.
Q3 Adj. EBITDA $m
Direct Marketing (¹)
US Acquiring and
Integrated eComm.
$173
Q3'20
excl. Pay Later ²)
$48
Q3'20
excl. Pay Later (2)
$187
Q3'21
$44
Q3'21
16% growth(3) excl.
Pay Later and
Direct Marketing
19% growth(3) excl.
Pay Later and
Direct Marketing
Amounts predominately consist of direct marketing, but also includes additional card not present volumes in verticals with higher regulation and credit risk profiles including but not limited to insurance, multi-level marketing, credit monitoring
and repair, membership and dating as well as retail low risk volume primarily in automotive, restaurant, and retail industries
Figures exclude Pay Later, which was divested in October 2020. See appendix for a reconciliation of this non-GAAP financial measure.
Reflects Integrated Processing segment minus Direct Marketing. Revenue amounts totaled $168 million in Q3'21 and $144 million in Q3'20. For Adjusted EBITDA, amounts totaled $38 million in Q3'21 and $32 million in Q3'20. Revenue amounts
totaled $493 million YTD 2021 and $425 million in YTD 2020. For Adjusted EBITDA, amounts totaled $111 million in YTD 2021 and $97 million in YTD 2020. Direct Marketing Adj. EBITDA amounts do not include allocation of shared costs.
25View entire presentation