Syniverse SPAC Presentation Deck
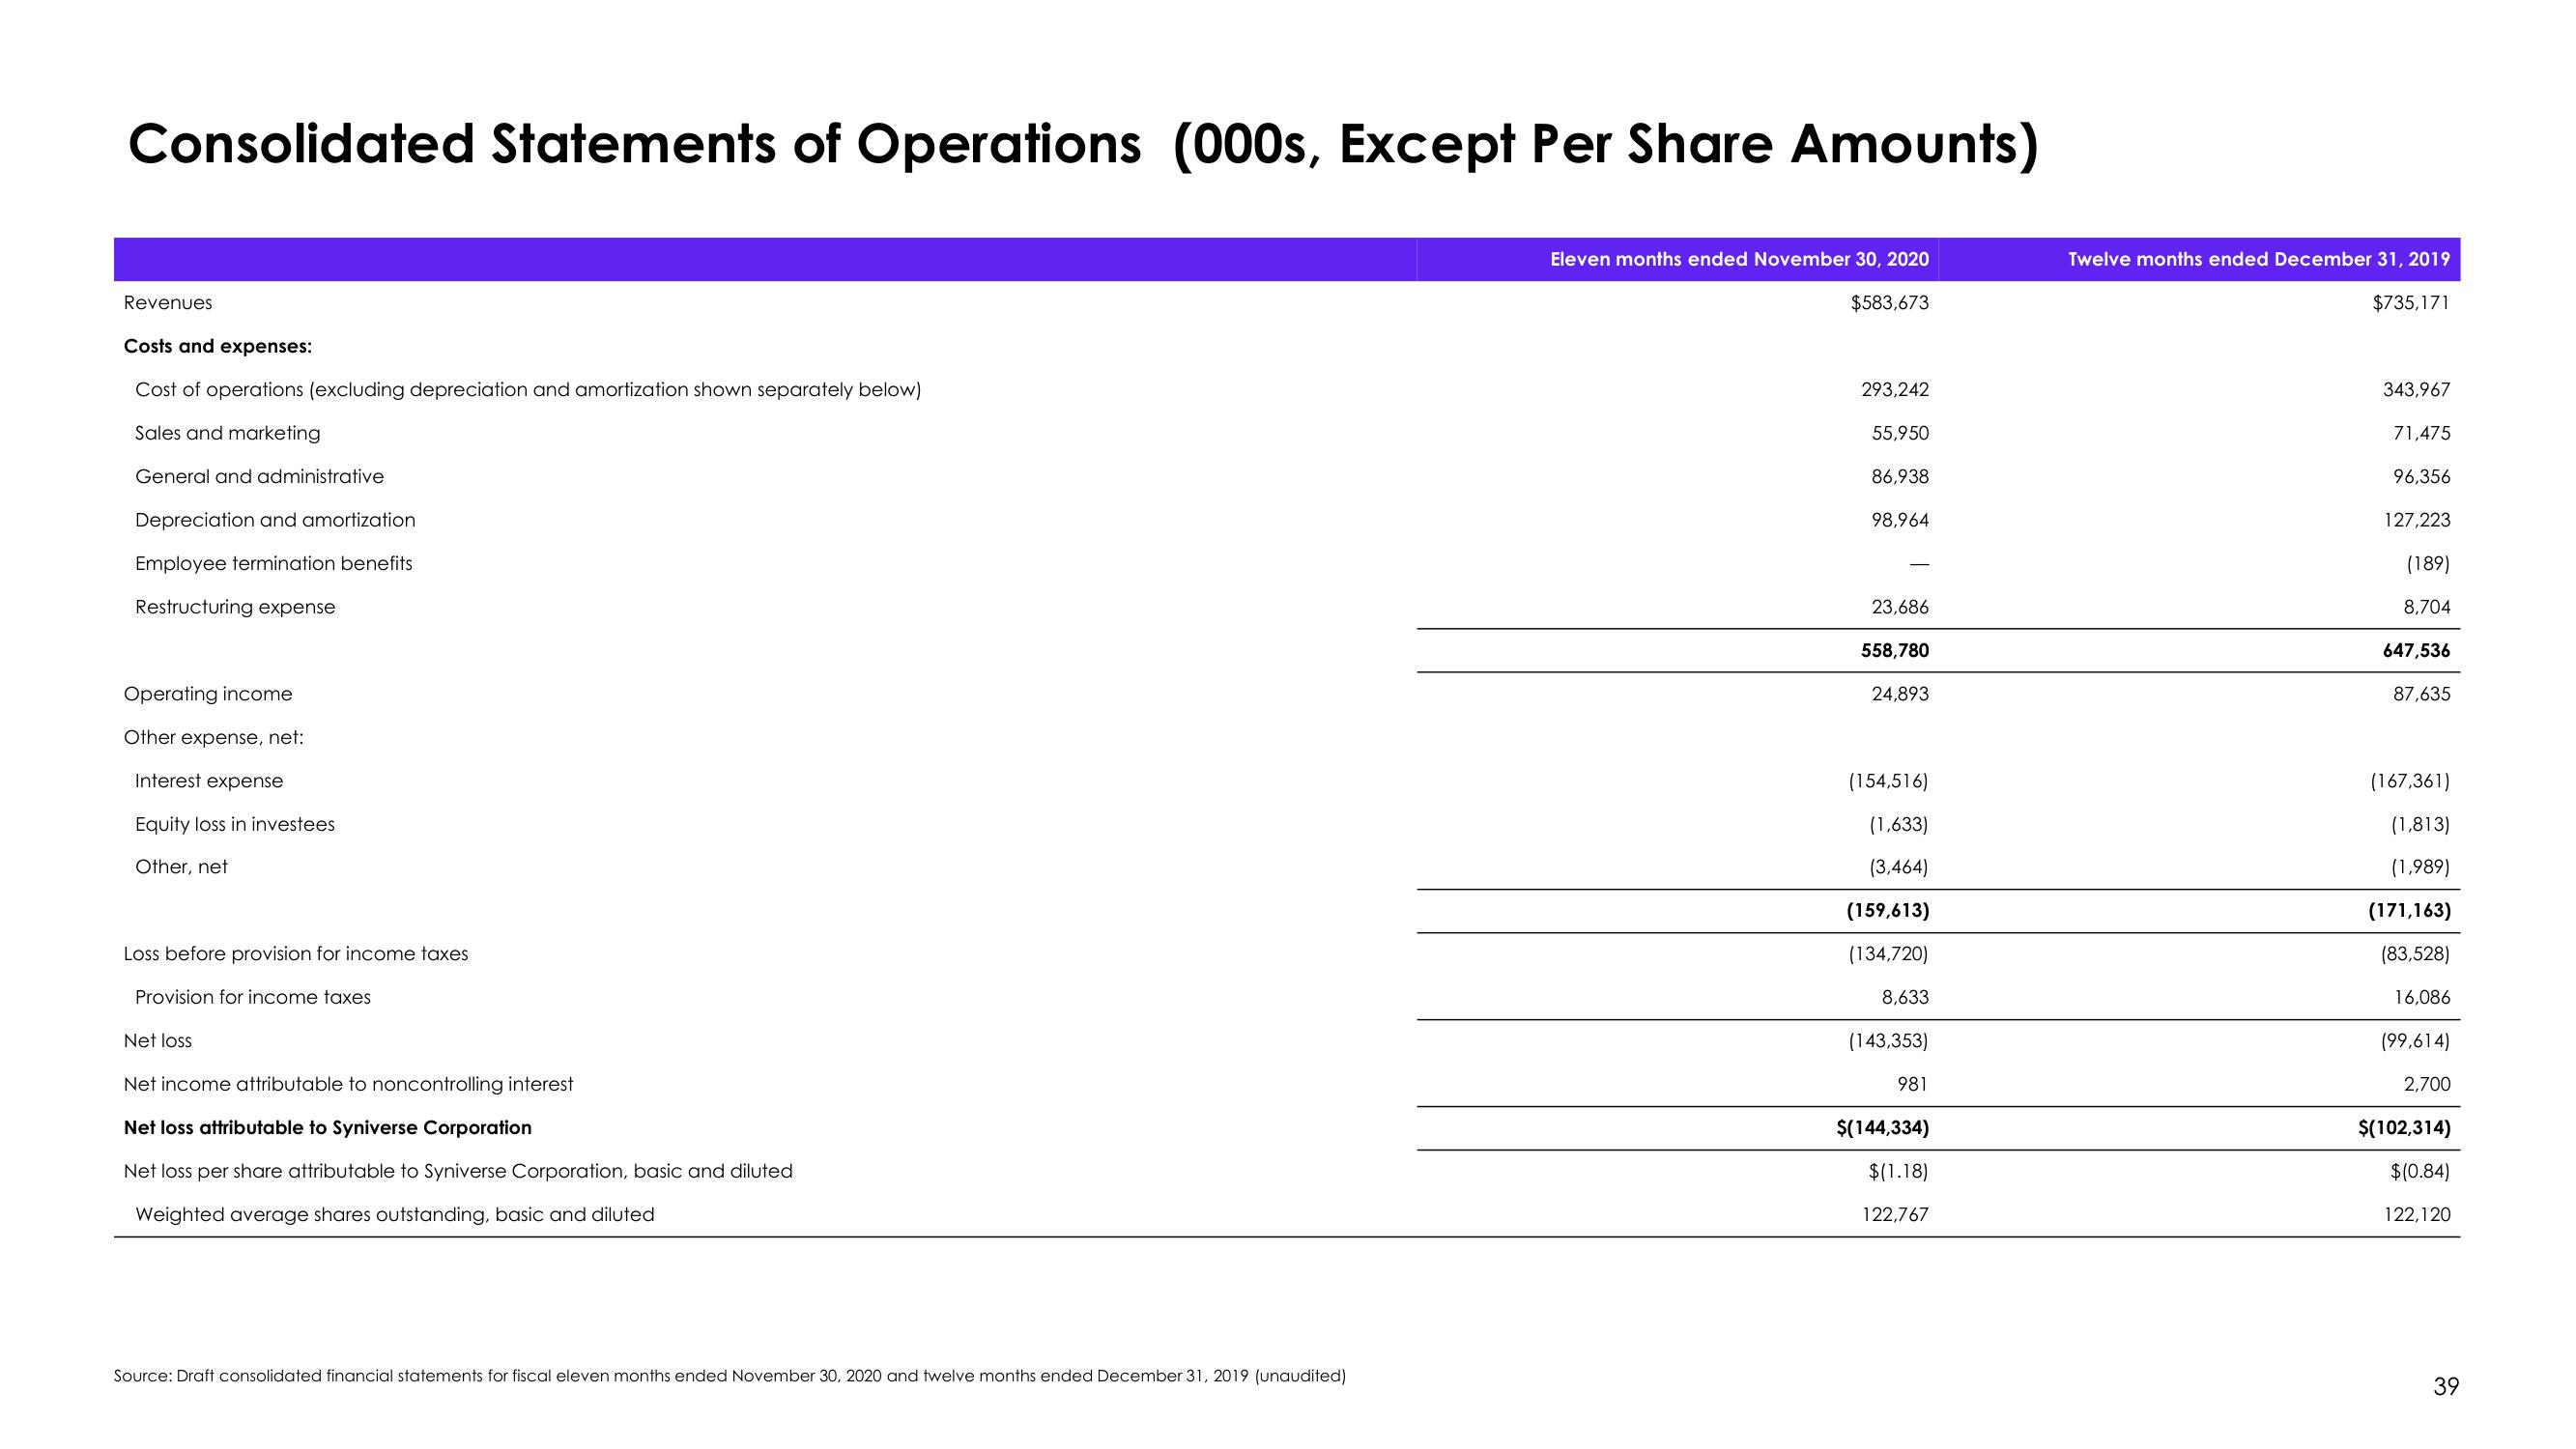
Consolidated Statements of Operations (000s, Except Per Share Amounts)
Revenues
Costs and expenses:
Cost of operations (excluding depreciation and amortization shown separately below)
Sales and marketing
General and administrative
Depreciation and amortization
Employee termination benefits
Restructuring expense
Operating income
Other expense, net:
Interest expense
Equity loss in investees
Other, net
Loss before provision for income taxes
Provision for income taxes
Net loss
Net income attributable to noncontrolling interest
Net loss attributable to Syniverse Corporation
Net loss per share attributable to Syniverse Corporation, basic and diluted
Weighted average shares outstanding, basic and diluted
Source: Draft consolidated financial statements for fiscal eleven months ended November 30, 2020 and twelve months ended December 31, 2019 (unaudited)
Eleven months ended November 30, 2020
$583,673
293,242
55,950
86,938
98,964
23,686
558,780
24,893
(154,516)
(1,633)
(3,464)
(159,613)
(134,720)
8,633
(143,353)
981
$(144,334)
$(1.18)
122,767
Twelve months ended December 31, 2019
$735,171
343,967
71,475
96,356
127,223
(189)
8,704
647,536
87,635
(167,361)
(1,813)
(1,989)
(171,163)
(83,528)
16,086
(99,614)
2,700
$(102,314)
$(0.84)
122,120
39View entire presentation