Silicon Valley Bank Results Presentation Deck
Long-term tailwinds supporting the innovation economy
remain intact
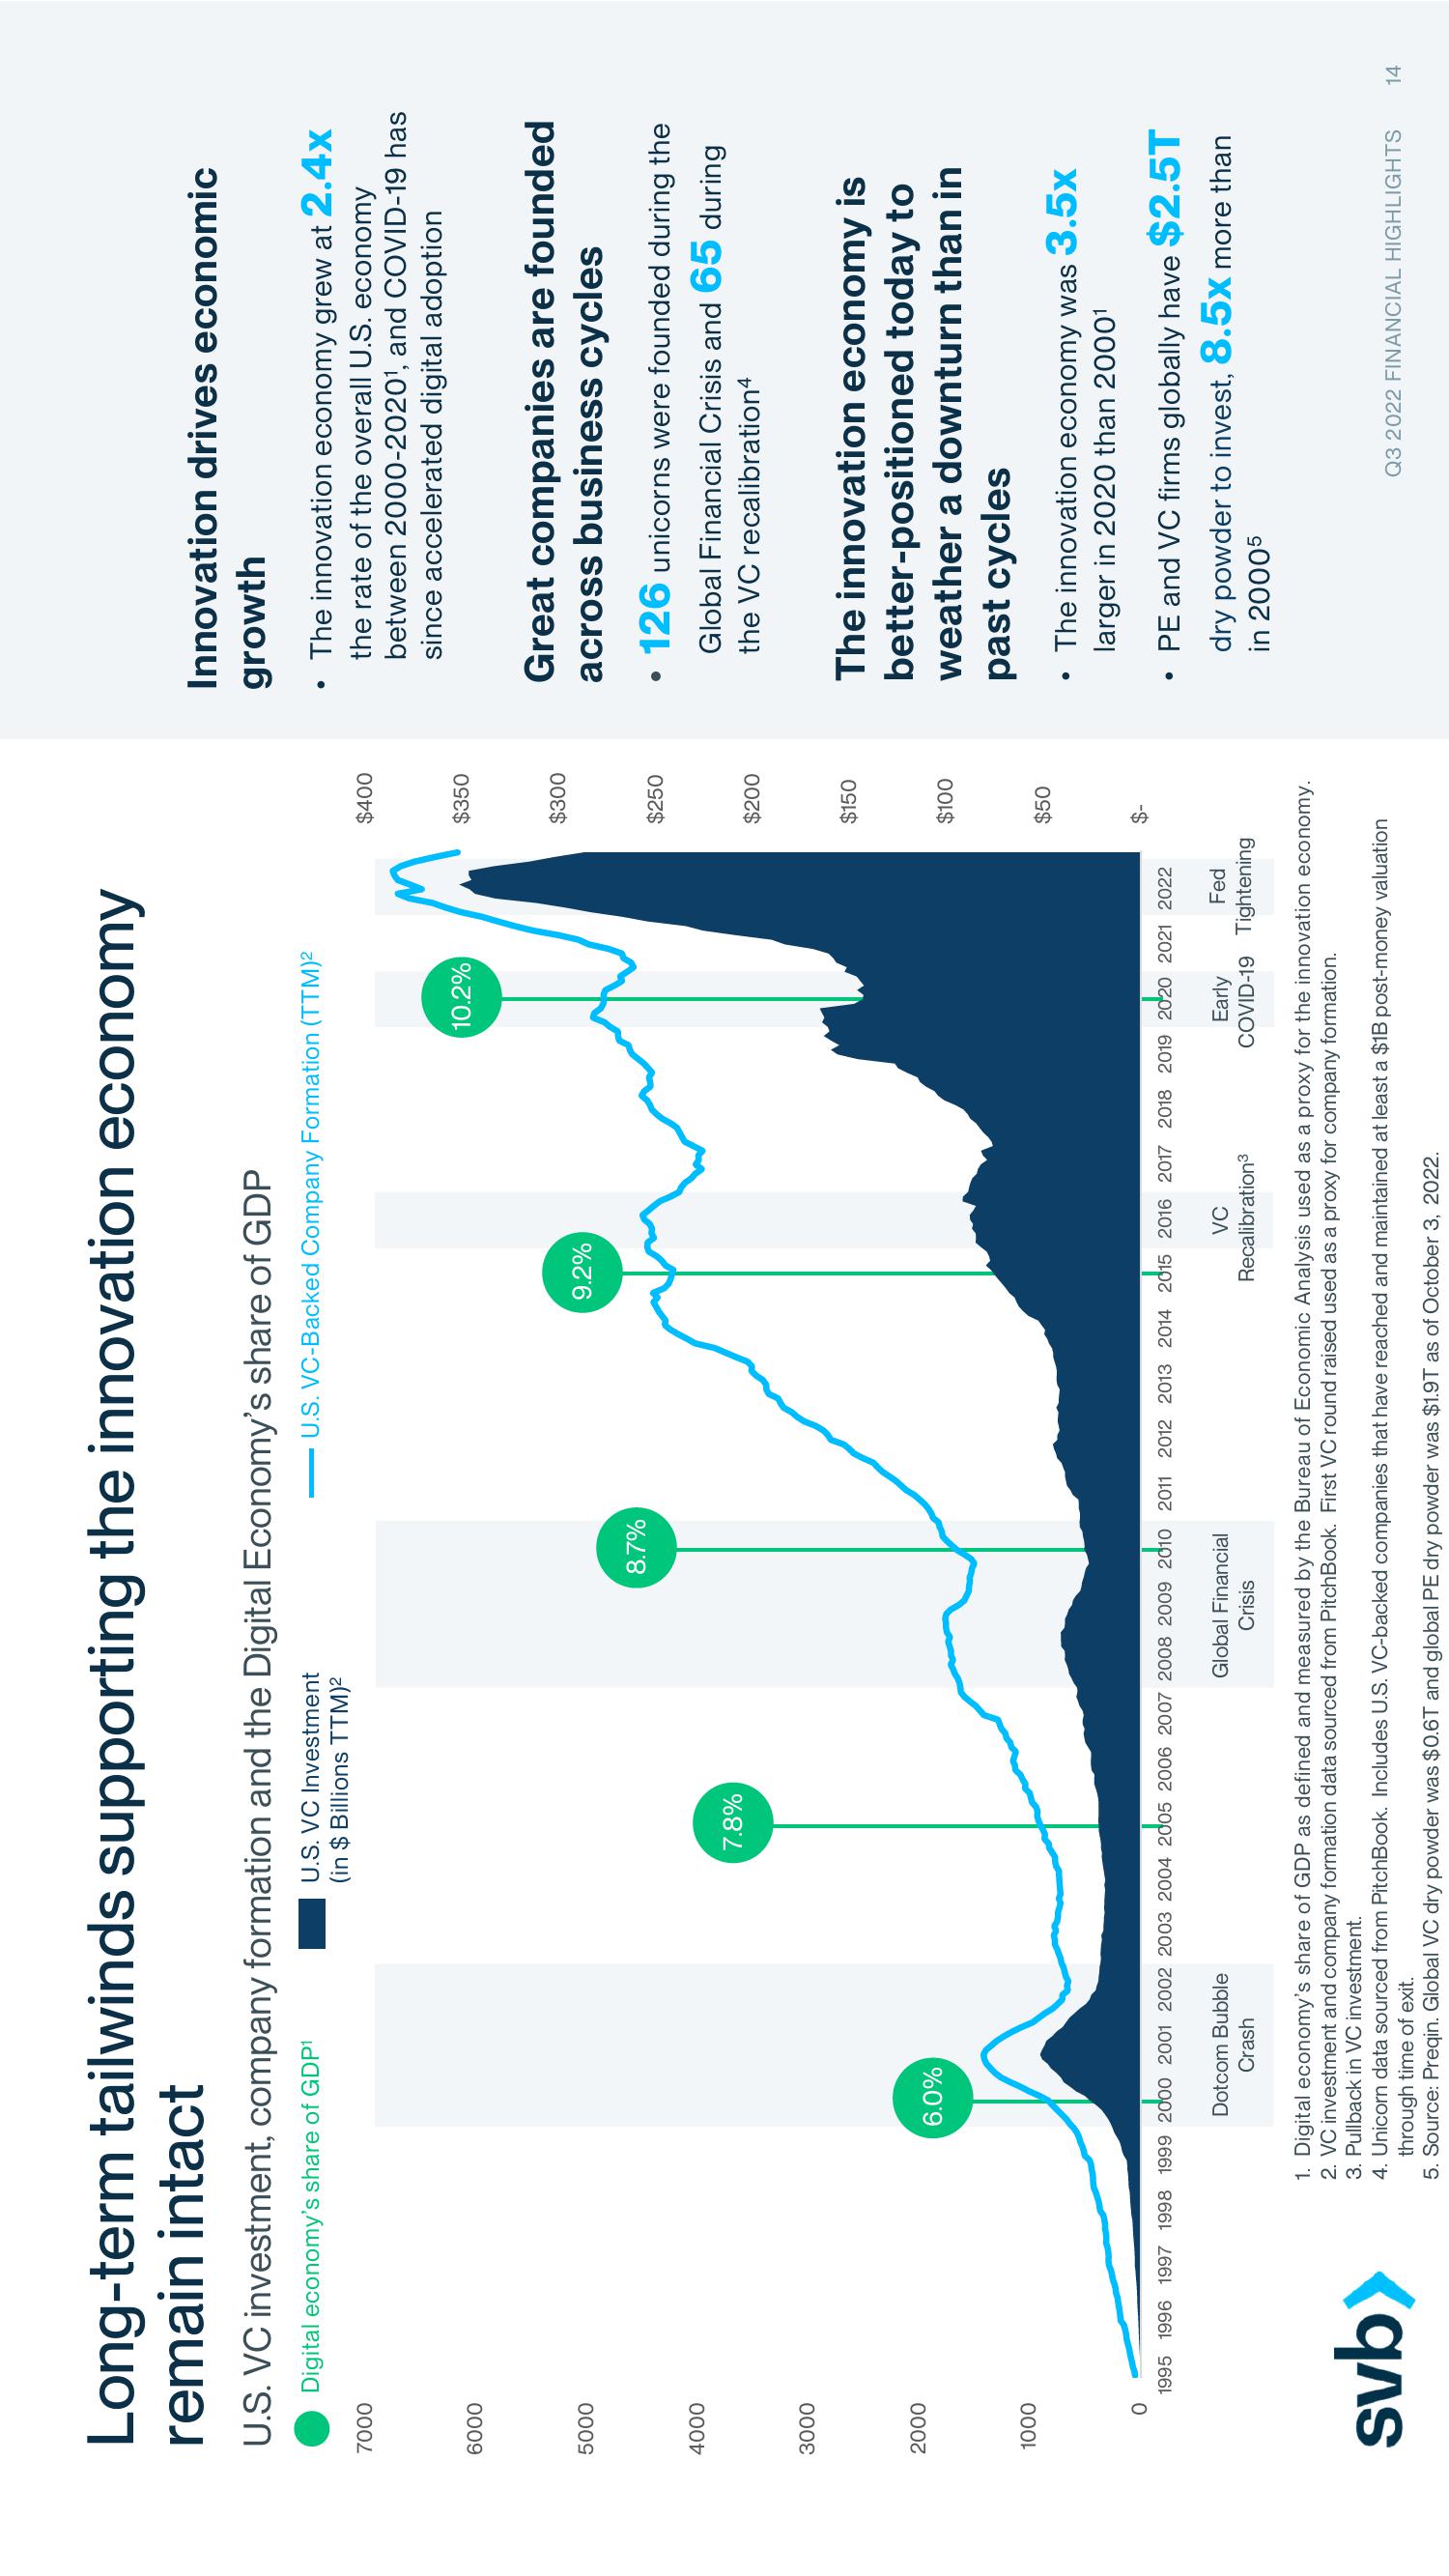
U.S. VC investment, company formation and the Digital Economy's share of GDP
Digital economy's share of GDP¹
7000
6000
5000
4000
3000
2000
1000
6.0%
svb>
U.S. VC Investment
(in $ Billions TTM)²
Dotcom Bubble
Crash
7.8%
8.7%
- U.S. VC-Backed Company Formation (TTM)²
0
2000
2005
2010
2015
2020
1995 1996 1997 1998 1999 2000 2001 2002 2003 2004 2005 2006 2007 2008 2009 2010 2011 2012 2013 2014 2015 2016 2017 2018 2019 2020 2021 2022
Global Financial
Crisis
9.2%
10.2%
VC
Recalibration³
Early
Fed
COVID-19 Tightening
$400
$350
$300
$250
$200
$150
$100
$50
S
1. Digital economy's share of GDP as defined and measured by the Bureau of Economic Analysis used as a proxy for the innovation economy.
2. VC investment and company formation data sourced from PitchBook. First VC round raised used as a proxy for company formation.
3. Pullback in VC investment.
4. Unicorn data sourced from PitchBook. Includes U.S. VC-backed companies that have reached and maintained at least a $1B post-money valuation
through time of exit.
5. Source: Preqin. Global VC dry powder was $0.6T and global PE dry powder was $1.9T as of October 3, 2022.
Innovation drives economic
growth
Great companies are founded
across business cycles
The innovation economy grew at 2.4x
the rate of the overall U.S. economy
between 2000-2020¹, and COVID-19 has
since accelerated digital adoption
• 126 unicorns were founded during the
Global Financial Crisis and 65 during
the VC recalibration4
The innovation economy is
better-positioned today to
weather a downturn than in
past cycles
●
●
The innovation economy was 3.5x
larger in 2020 than 2000¹
PE and VC firms globally have $2.5T
dry powder to invest, 8.5x more than
in 20005
Q3 2022 FINANCIAL HIGHLIGHTS 14View entire presentation