Kinnevik Results Presentation Deck
Intro
NET ASSET VALUE
TELE2, FINANCIAL POSITION & TOTALITY
SEKM
Tele2
Total Portfolio Value
Gross Cash
Gross Debt
Net Cash / (Debt)
Other Net Assets/(Liabilities)
Total Net Asset Value
Net Asset Value Per Share, SEK
Closing Price, Class B Share, SEK
Note:
Growth Portfolio
32.3
Invested
Capital
Net Asset Value
KINNEVIK
SEKbn
42.4
8.6
33.9
Fair Value &
Released Capital
Vintage
Interim Report - Q2 2023
1993
Portfolio Overview
Tele2
27%
Ownership
20%
3%
Listed Growth
Value
Q2 2023
12 283
Unlisted Growth
70%
46 151
tAssets/(Liabilities) include the reservation from Q4 2020 regarding a potential capital gains tax liability of SEK 0.8bn relating to the merger between Teladoc and Livongo, based on the rules for accounting for uncertain tax positions in IFRIC 23.
12 518
- 3 732
8 786
- 887
54 050
191.93
149.70
Sustainability
Composition of Portfolio Value
At Quarter-End
Tele2
27%
2016-23 Investments
72%
Financial Statements
1%
Pre 2016 Investments
Value
Q1 2023
14 188
45
737
14 242
- 3 736
10 506
- 783
55 460
198.02
154.55
Other
Value
Q4 2022
11 752
43 385
14 134
- 3 747
10 387
- 866
52 906
188.90
143.50
Value
Q2 2022
16 02
48 341
17 218
-3 626
13 592
-793
61 140
218.32
164.75
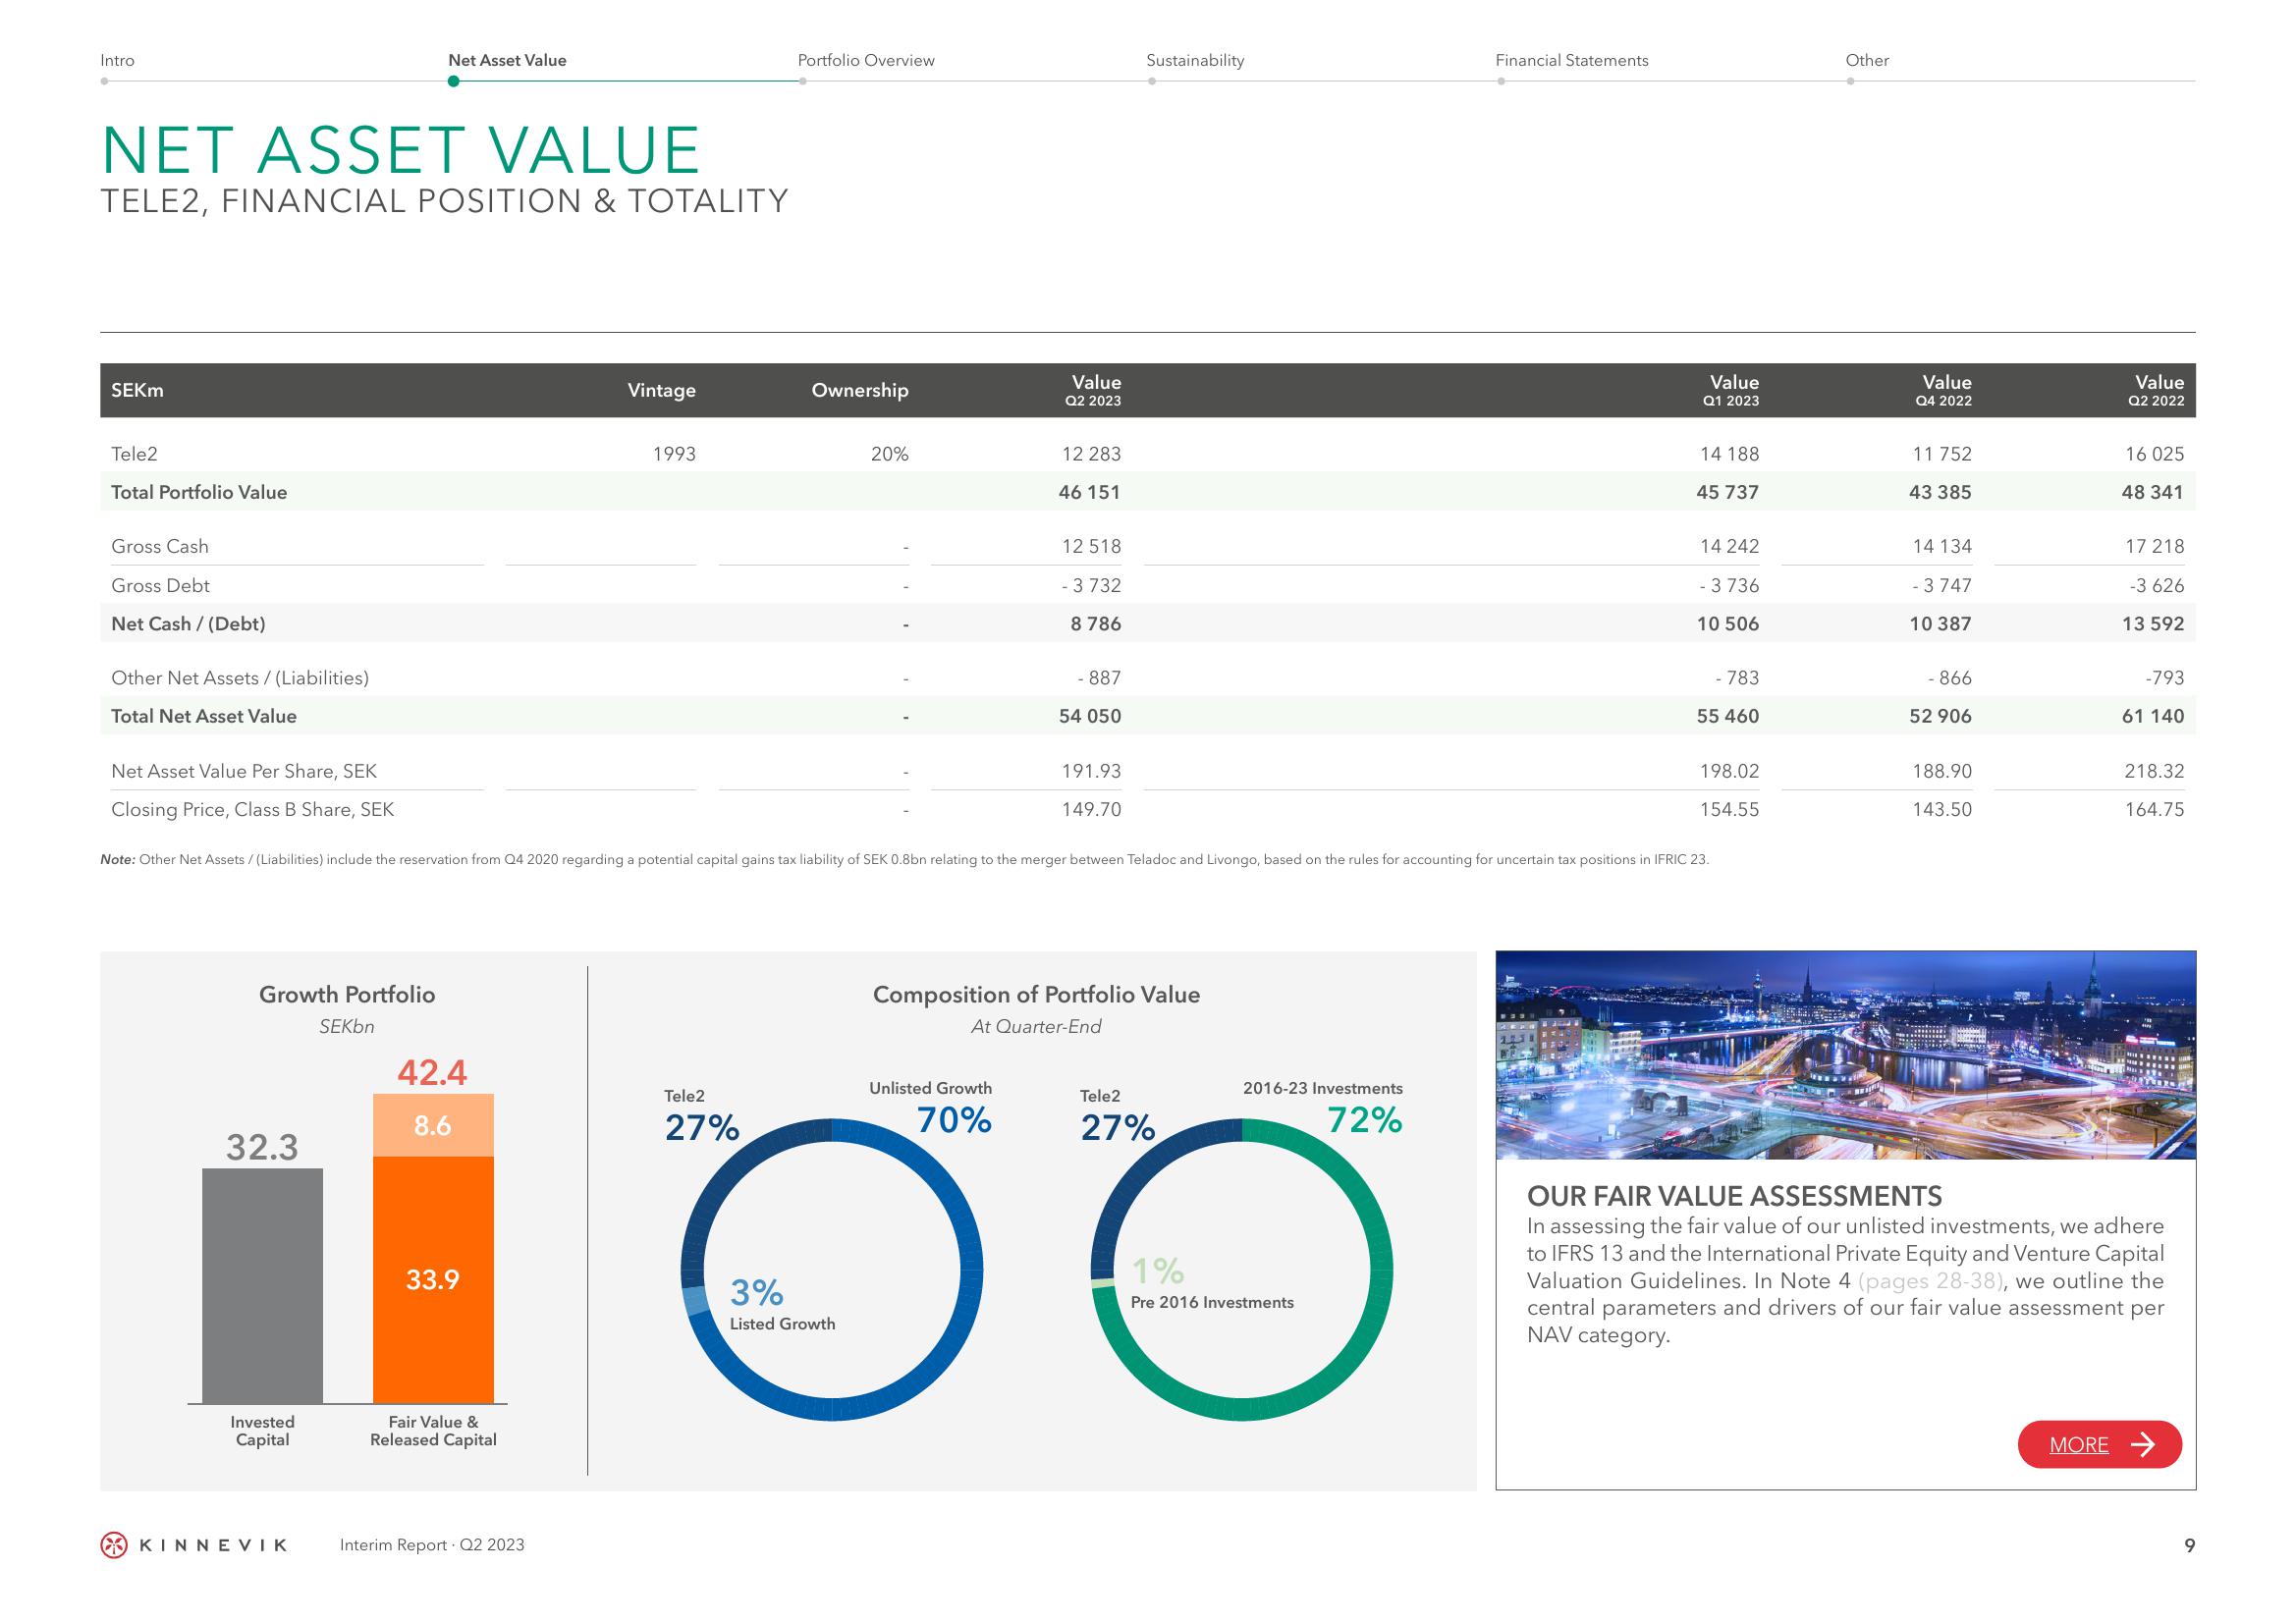
OUR FAIR VALUE ASSESSMENTS
In assessing the fair value of our unlisted investments, we adhere
to IFRS 13 and the International Private Equity and Venture Capital
Valuation Guidelines. In Note 4 (pages 28-38), we outline the
central parameters and drivers of our fair value assessment per
NAV category.
MORE →
9View entire presentation