Pathward Financial Results Presentation Deck
COMMERCIAL FINANCE MIX ¹
●
MANUFACTURING
Computer and Electronic Product Manufacturing
Fabricated Metal Product Manufacturing
Transportation Equipment Manufacturing
Nonmetallic Mineral Product Manufacturing
Machinery Manufacturing
Electrical Equipment, Appliance, and Component Manufacturing
Plastics and Rubber Products Manufacturing
Chemical Manufacturing
Printing and Related Support Activities
Food Manufacturing
Other³
Total Exposure
●
●
Total Exposure
$419.1 million
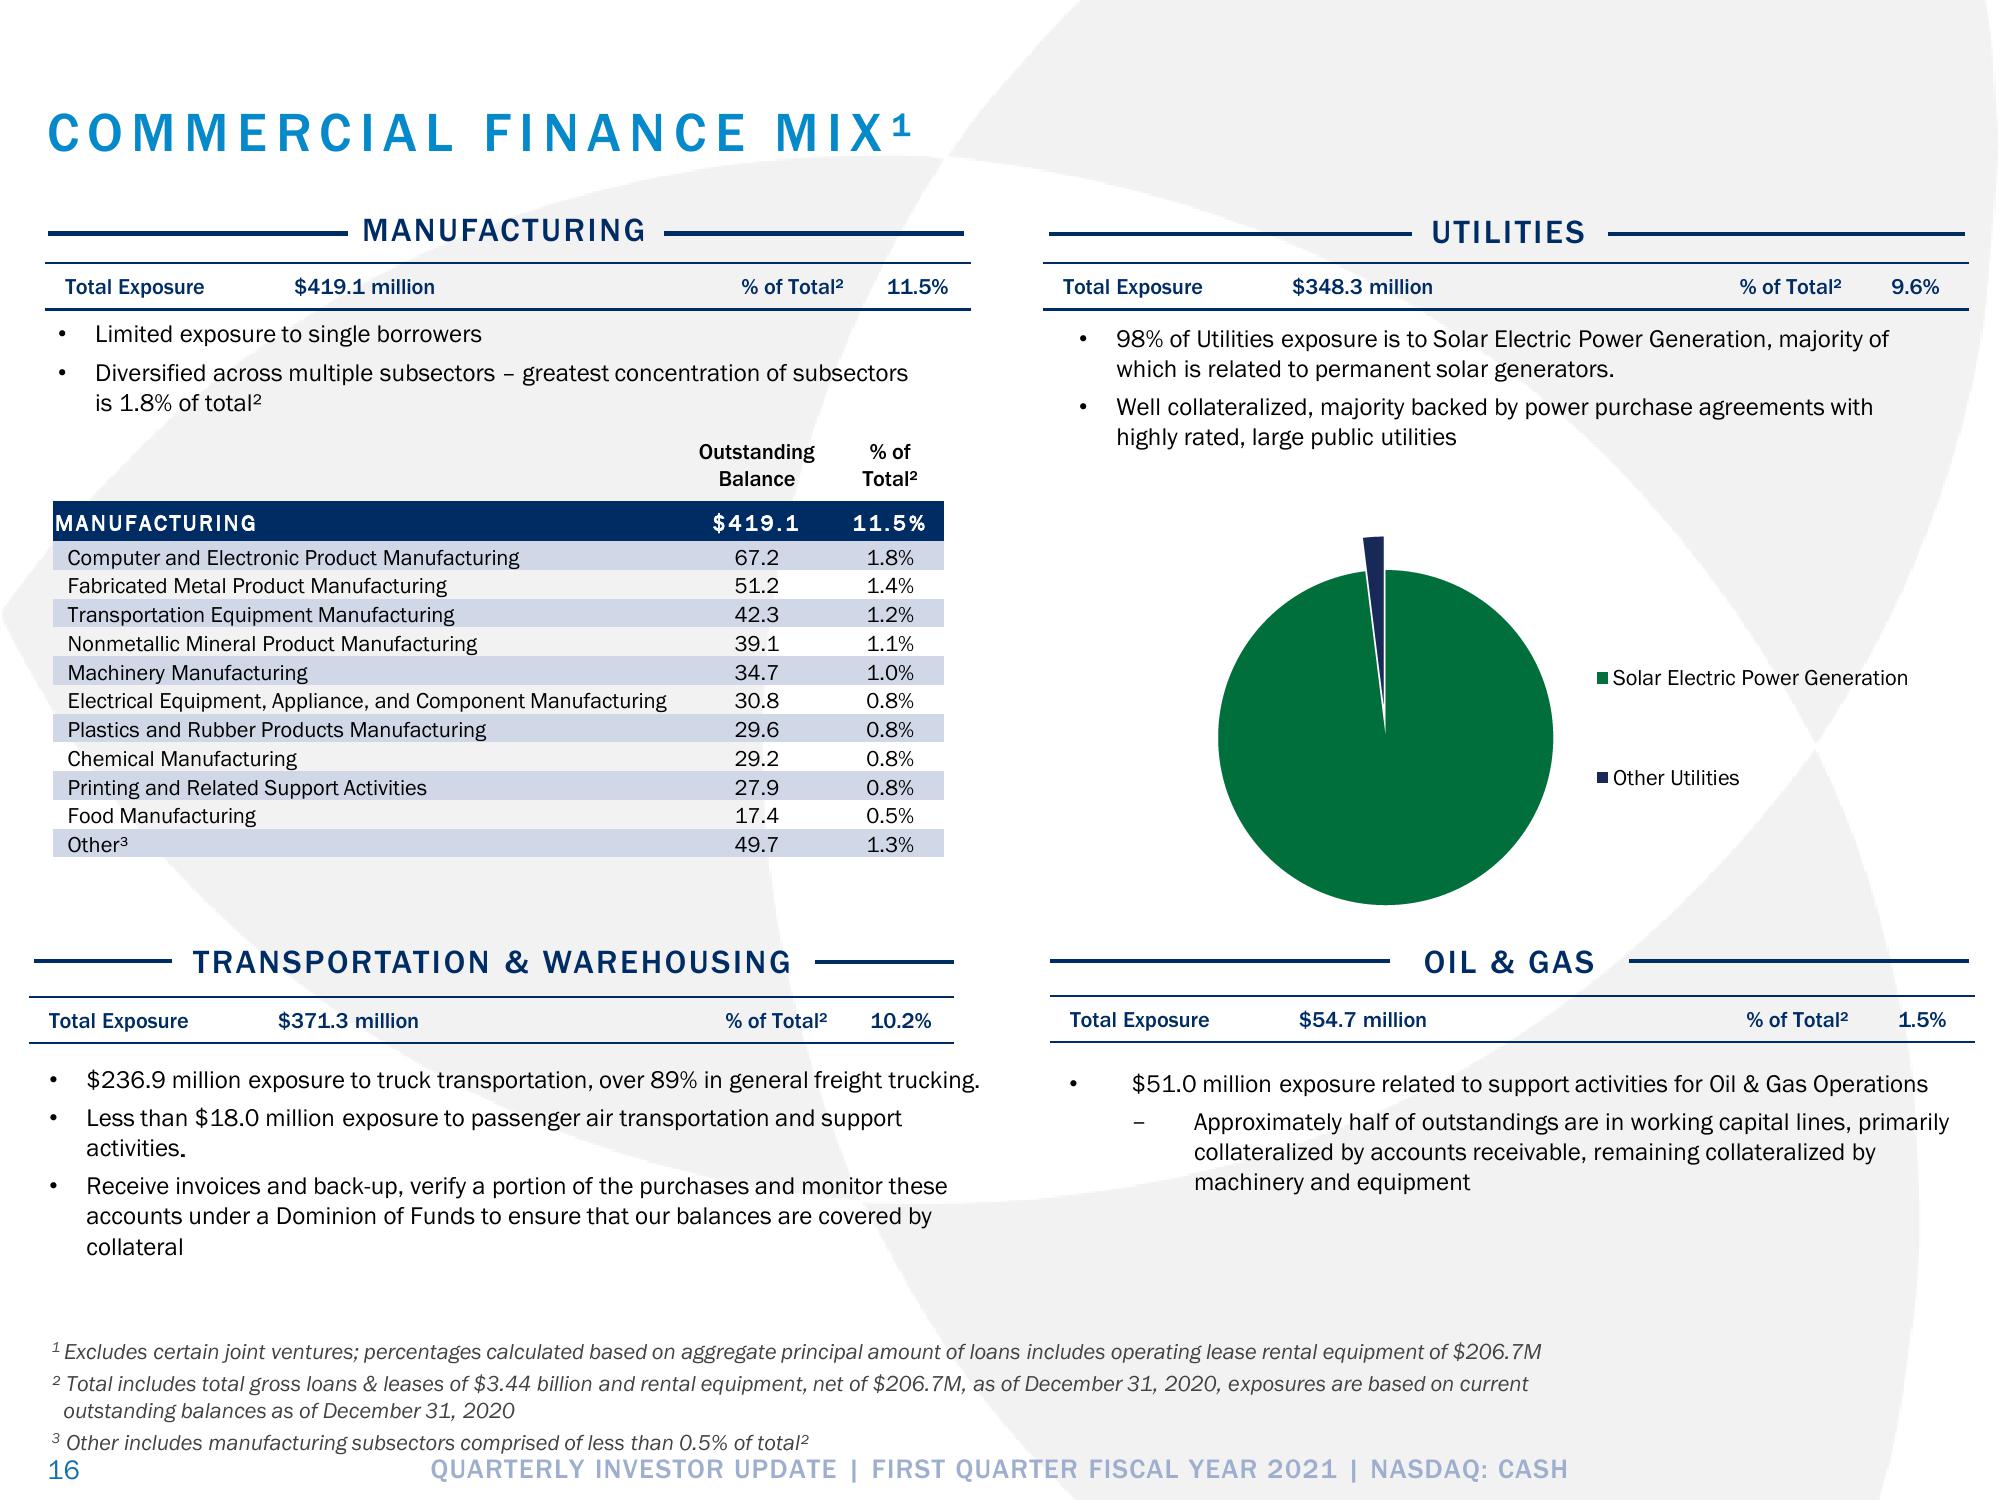
Limited exposure to single borrowers
Diversified across multiple subsectors - greatest concentration of subsectors
is 1.8% of total²
●
MANUFACTURING
% of Total² 11.5%
$371.3 million
Outstanding
Balance
$419.1
67.2
51.2
42.3
39.1
34.7
30.8
29.6
29.2
27.9
17.4
49.7
TRANSPORTATION & WAREHOUSING
% of
Total²
11.5%
1.8%
1.4%
1.2%
1.1%
1.0%
0.8%
0.8%
0.8%
0.8%
0.5%
1.3%
% of Total² 10.2%
$236.9 million exposure to truck transportation, over 89% in general freight trucking.
Less than $18.0 million exposure to passenger air transportation and support
activities.
Receive invoices and back-up, verify a portion of the purchases and monitor these
accounts under a Dominion of Funds to ensure that our balances are covered by
collateral
3 Other includes manufacturing subsectors comprised of less than 0.5% of total²
16
Total Exposure
98% of Utilities exposure is to Solar Electric Power Generation, majority of
which is related to permanent solar generators.
●
.
$348.3 million
Total Exposure
UTILITIES
Well collateralized, majority backed by power purchase agreements with
highly rated, large public utilities
OIL & GAS
$54.7 million
Excludes certain joint ventures; percentages calculated based on aggregate principal amount of loans includes operating lease rental equipment of $206.7M
2 Total includes total gross loans & leases of $3.44 billion and rental equipment, net of $206.7M, as of December 31, 2020, exposures are based on current
outstanding balances as of December 31, 2020
% of Total²
QUARTERLY INVESTOR UPDATE | FIRST QUARTER FISCAL YEAR 2021 | NASDAQ: CASH
■Solar Electric Power Generation
Other Utilities
9.6%
% of Total²
$51.0 million exposure related to support activities for Oil & Gas Operations
Approximately half of outstandings are in working capital lines, primarily
collateralized by accounts receivable, remaining collateralized by
machinery and equipment
1.5%View entire presentation