Flutter Results Presentation Deck
UK & Ireland
Pro forma £m
Average monthly players ('000s)
Sportsbook stakes
Sportsbook net revenue margin
Sports revenue
Gaming revenue
Total revenue
Cost of sales
Cost of sales as a % of net revenue
Gross profit
Sales & marketing costs
Contribution
Other operating costs
Adjusted EBITDA
Adjusted EBITDA margin
Depreciation and amortisation
Adjusted operating profit
Flutter
FY 2021
3,153
10,473
9.7%
1,168
721
1,889
(581)
30.8%
YOY
2,532
+25%
8,401
+25%
11.7% -200bps
+2%
+5%
1,829
+3%
(534) +9%
29.2% +160bps
1,308
1,295
+1%
(384)
(369)
+4%
923
927
flat
(298) (298)
flat
626
629
flat
34.4%
-130bps
(77) +11%
552
-2%
ONLINE
33.1%
(85)
541
FY 2020
1,143
686
RETAIL
FY 2021 FY 2020
904
12.6%
114
60
174
(40)
22.9%
134
(6)
128
(138) (148)
(10)
2
0.9%
(5.6%)
(41)
(43)
(50)
(41)
YOY
998
-9%
14.3%
-170bps
143
-20%
57
+5%
200
-13%
(44)
-9%
21.8% +100bps
-14%
-2%
-15%
-7%
-647%
-650bps
-4%
+23%
156
(6)
150
Online
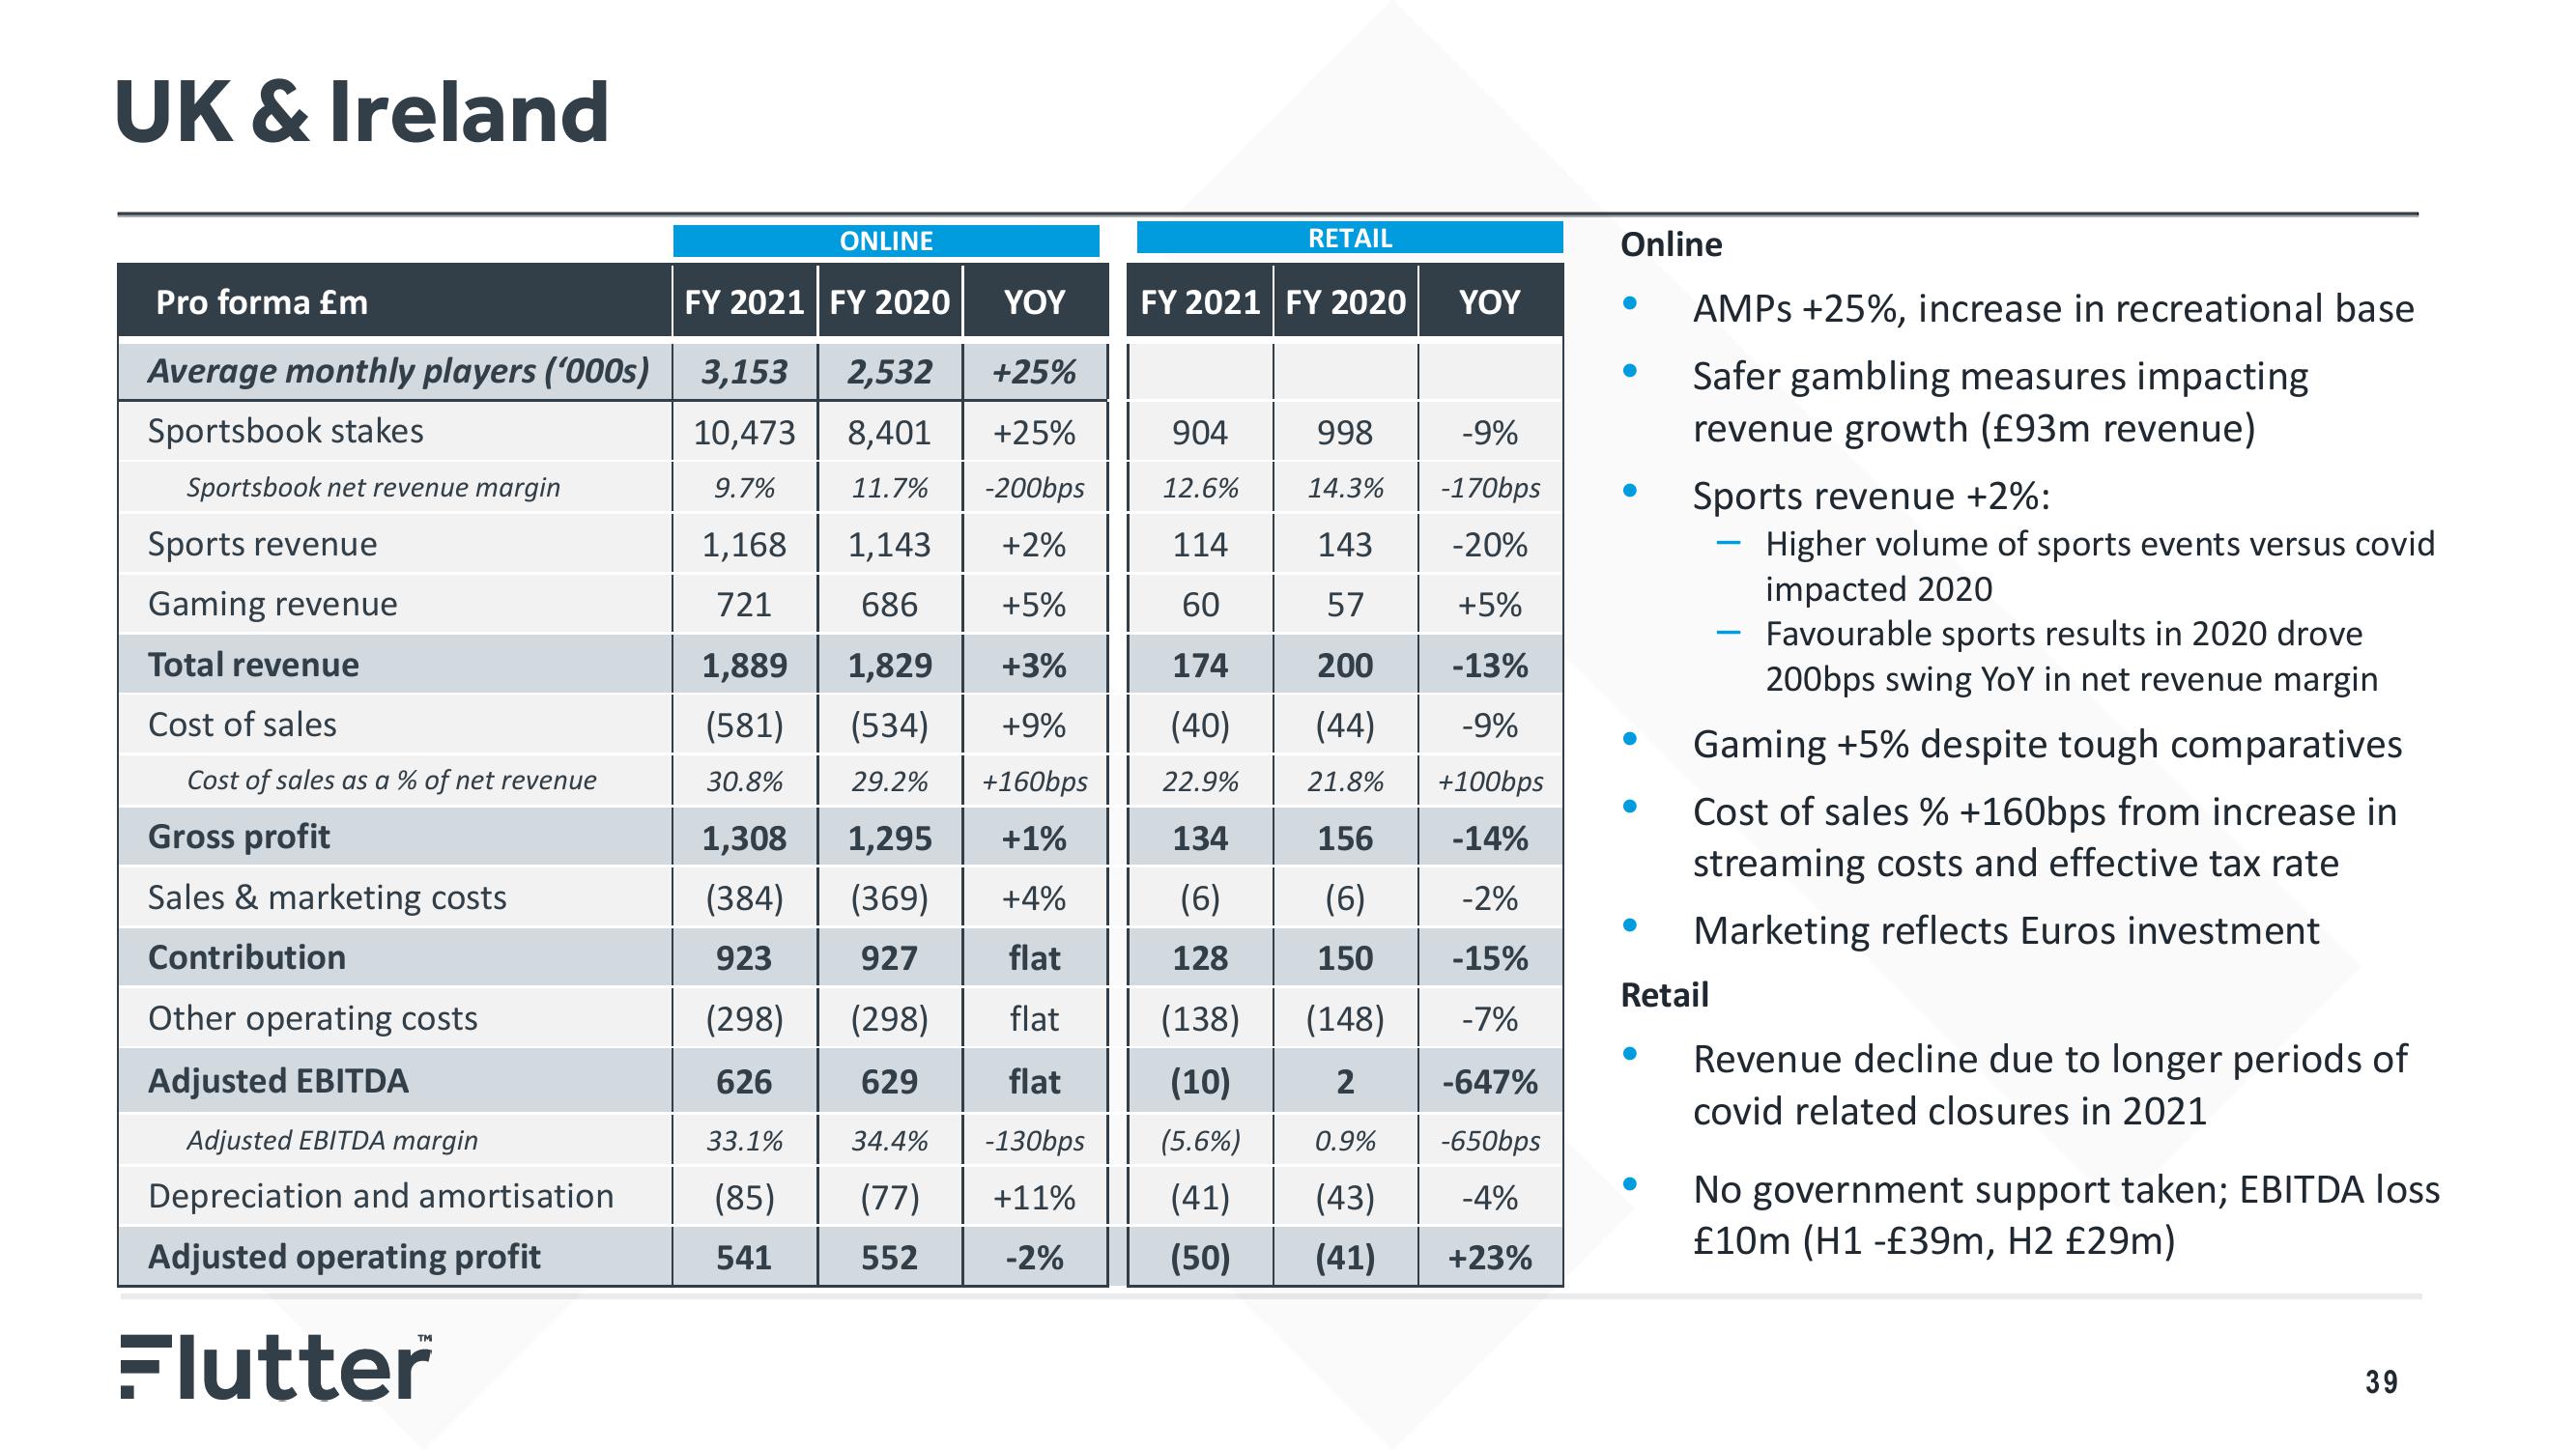
AMPS +25%, increase in recreational base
Safer gambling measures impacting
revenue growth (£93m revenue)
Sports revenue +2%:
Higher volume of sports events versus covid
impacted 2020
Favourable sports results in 2020 drove
200bps swing YoY in net revenue margin
Gaming +5% despite tough comparatives
Cost of sales % +160bps from increase in
streaming costs and effective tax rate
Marketing reflects Euros investment
Retail
-
-
Revenue decline due to longer periods of
covid related closures in 2021
No government support taken; EBITDA loss
£10m (H1 -£39m, H2 £29m)
39View entire presentation