Solar Industry Update
Installations (GWdc)
40
35
450
25
20
15
10
International H1 2023
Installations
H2
H1
↑
106 GW
...]
2022
2023 2022
Germany
China
74 GW
510 GW
2023
95 GW
•
•
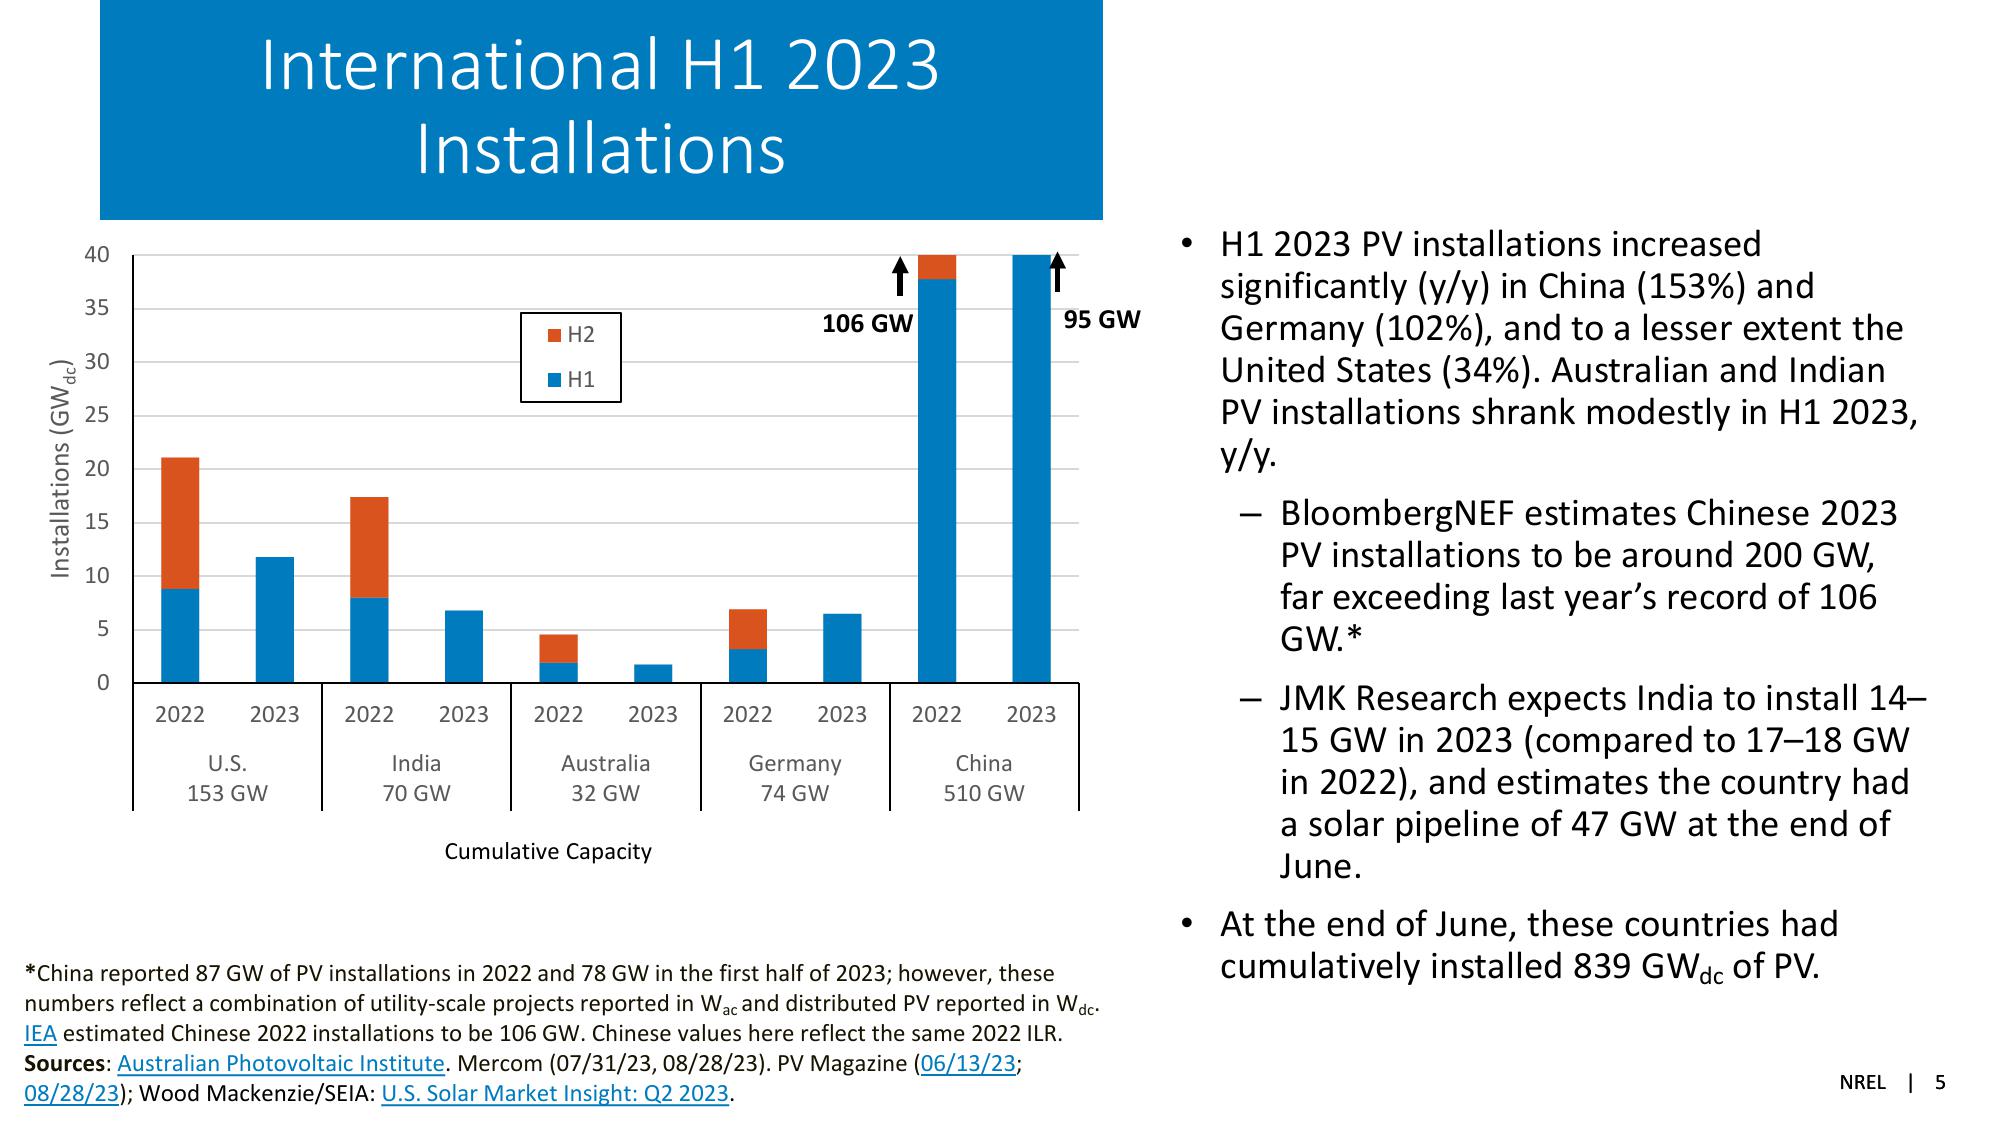
H1 2023 PV installations increased
significantly (y/y) in China (153%) and
Germany (102%), and to a lesser extent the
United States (34%). Australian and Indian
PV installations shrank modestly in H1 2023,
y/y.
-
-
Bloomberg NEF estimates Chinese 2023
PV installations to be around 200 GW,
far exceeding last year's record of 106
GW.*
JMK Research expects India to install 14-
15 GW in 2023 (compared to 17-18 GW
in 2022), and estimates the country had
a solar pipeline of 47 GW at the end of
June.
At the end of June, these countries had
cumulatively installed 839 GWdc of PV.
5
0
2022 2023
2022 2023
2022 2023
U.S.
153 GW
India
70 GW
Australia
32 GW
Cumulative Capacity
*China reported 87 GW of PV installations in 2022 and 78 GW in the first half of 2023; however, these
numbers reflect a combination of utility-scale projects reported in Wac and distributed PV reported in Wdc.
IEA estimated Chinese 2022 installations to be 106 GW. Chinese values here reflect the same 2022 ILR.
Sources: Australian Photovoltaic Institute. Mercom (07/31/23, 08/28/23). PV Magazine (06/13/23;
08/28/23); Wood Mackenzie/SEIA: U.S. Solar Market Insight: Q2 2023.
NREL 5View entire presentation