Samsara Investor Day Presentation Deck
68
Ⓒ Samsara Inc.
samsara
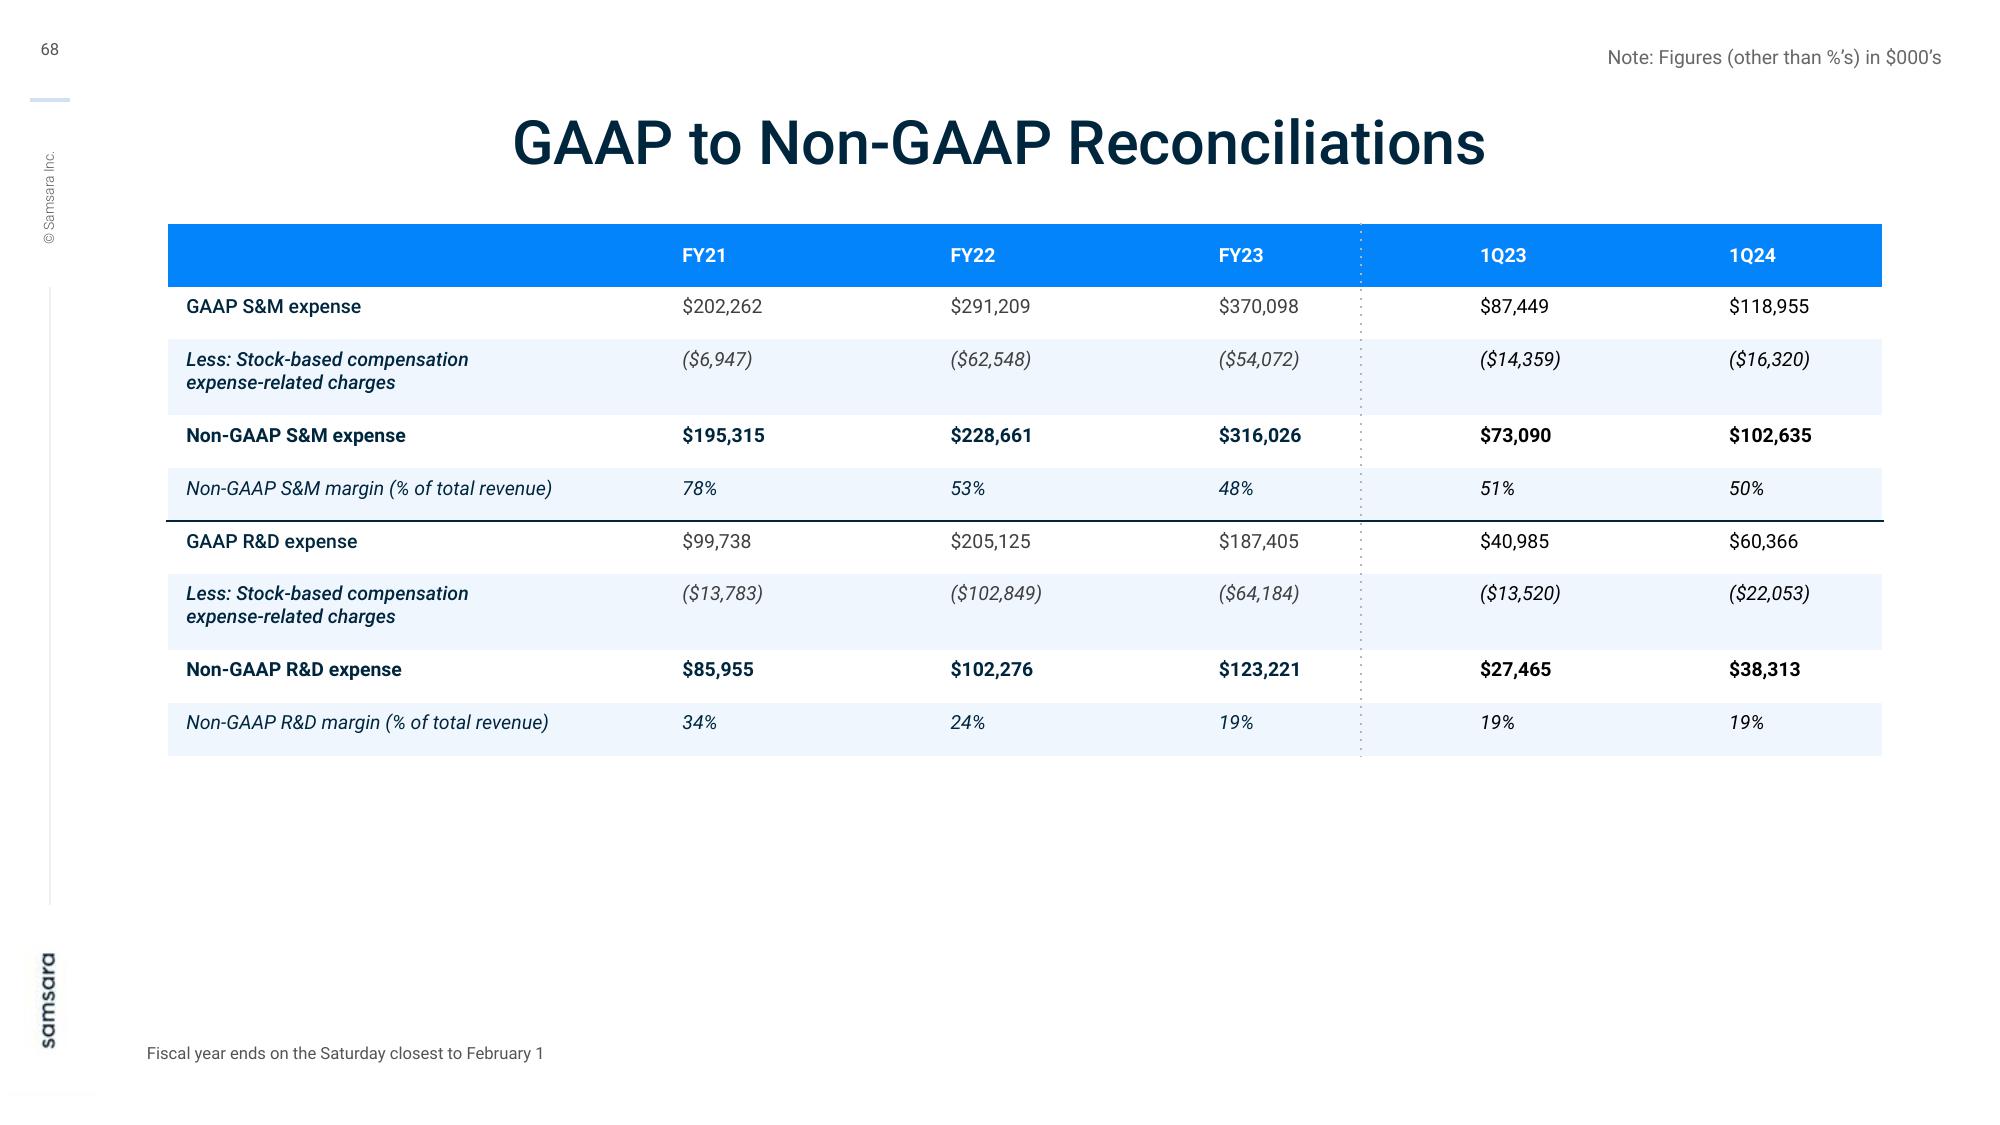
GAAP S&M expense
Less: Stock-based compensation
expense-related charges
GAAP to Non-GAAP Reconciliations
Non-GAAP S&M expense
Non-GAAP S&M margin (% of total revenue)
GAAP R&D expense
Less: Stock-based compensation
expense-related charges
Non-GAAP R&D expense
Non-GAAP R&D margin (% of total revenue)
Fiscal year ends on the Saturday closest to February 1
FY21
$202,262
($6,947)
$195,315
78%
$99,738
($13,783)
$85,955
34%
FY22
$291,209
($62,548)
$228,661
53%
$205,125
($102,849)
$102,276
24%
FY23
$370,098
($54,072)
$316,026
48%
$187,405
($64,184)
$123,221
19%
1023
$87,449
($14,359)
$73,090
51%
$40,985
($13,520)
$27,465
19%
Note: Figures (other than %'s) in $000's
1024
$118,955
($16,320)
$102,635
50%
$60,366
($22,053)
$38,313
19%View entire presentation