Pearson Investor Presentation Deck
Assessment & Qualifications
Growth drivers
Long-
term contracts with
high renewal rates
Key financial metrics*
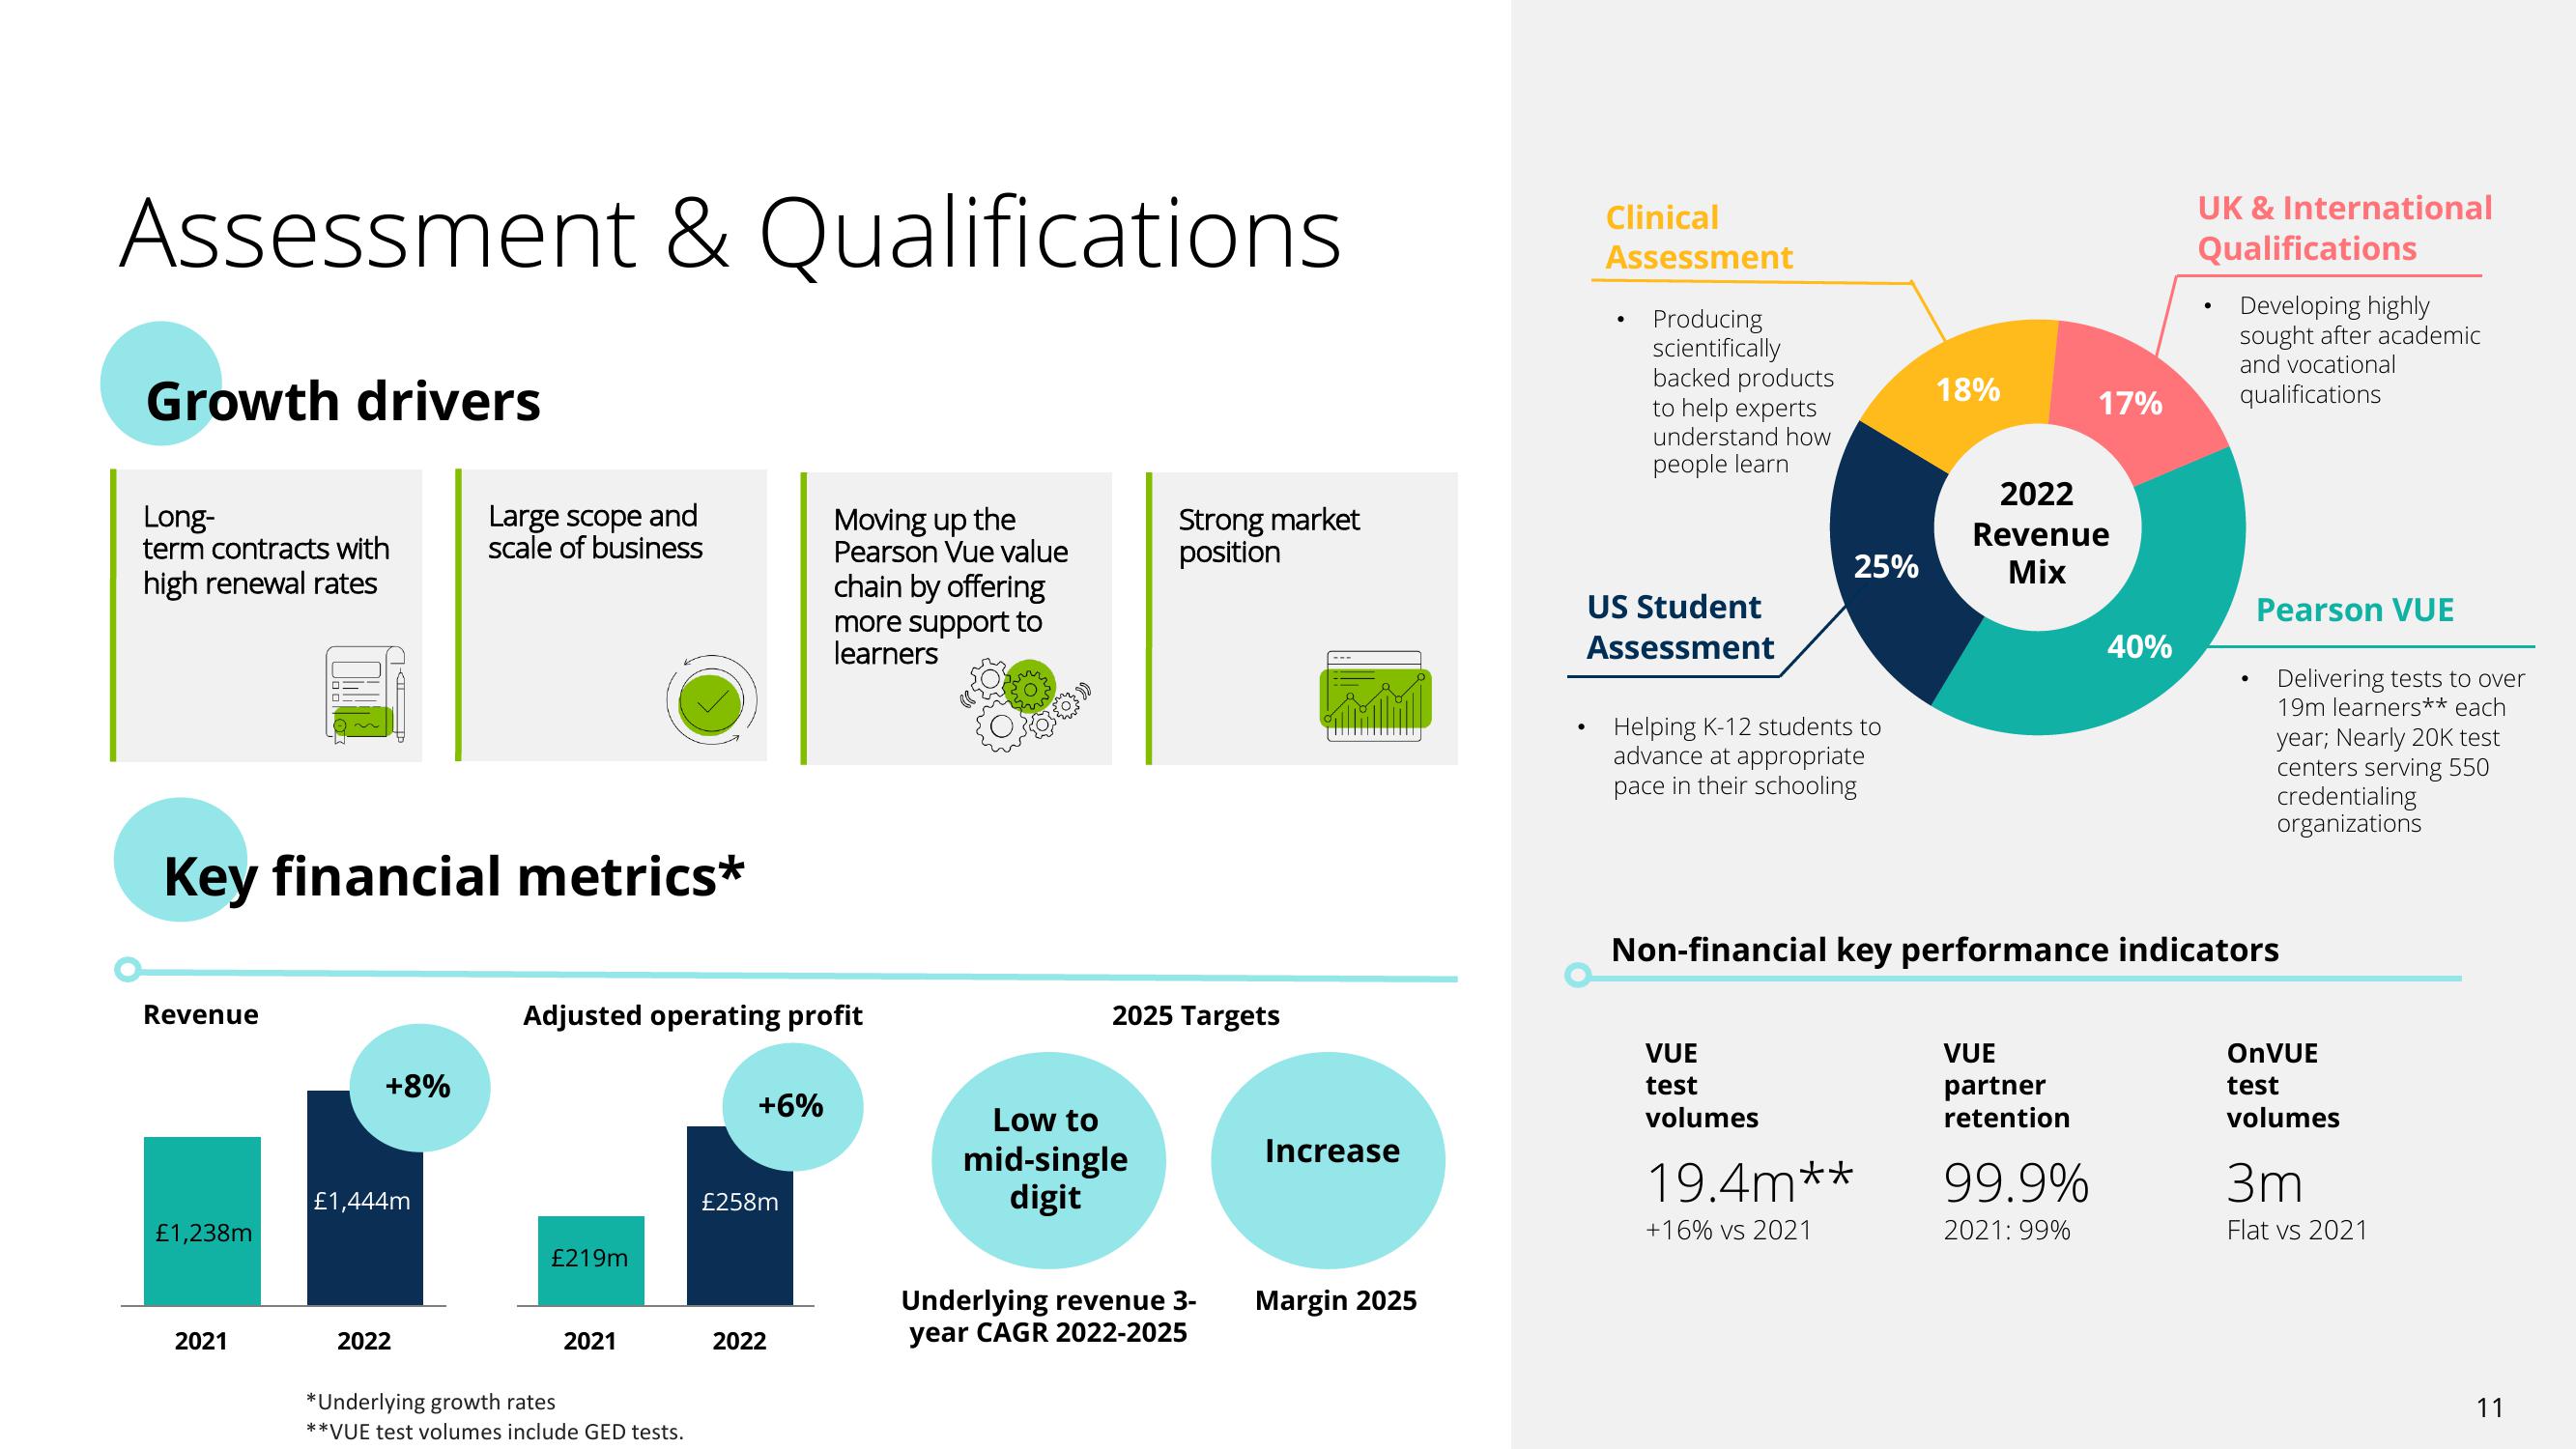
Revenue
£1,238m
2021
+8%
£1,444m
Large scope and
scale of business
2022
Adjusted operating profit
£219m
2021
*Underlying growth rates
**VUE test volumes include GED tests.
+6%
£258m
Moving up the
Pearson Vue value
chain by offering
more support to
learners
2022
Strong market
position
2025 Targets
Low to
mid-single
digit
Underlying revenue 3-
year CAGR 2022-2025
Increase
Margin 2025
Clinical
Assessment
.
.
Producing
scientifically
backed products
to help experts
understand how
people learn
US Student
Assessment
25%
Helping K-12 students to
advance at appropriate
pace in their schooling
VUE
test
volumes
18%
19.4m**
+16% vs 2021
2022
Revenue
Mix
17%
VUE
partner
retention
99.9%
2021: 99%
40%
Non-financial key performance indicators
UK & International
Qualifications
Developing highly
sought after academic
and vocational
qualifications
Pearson VUE
Delivering tests to over
19m learners** each
year; Nearly 20K test
centers serving 550
credentialing
organizations
OnVUE
test
volumes
3m
Flat vs 2021
11View entire presentation