Experian ESG Presentation Deck
Executive Summary
Improving Financial Health
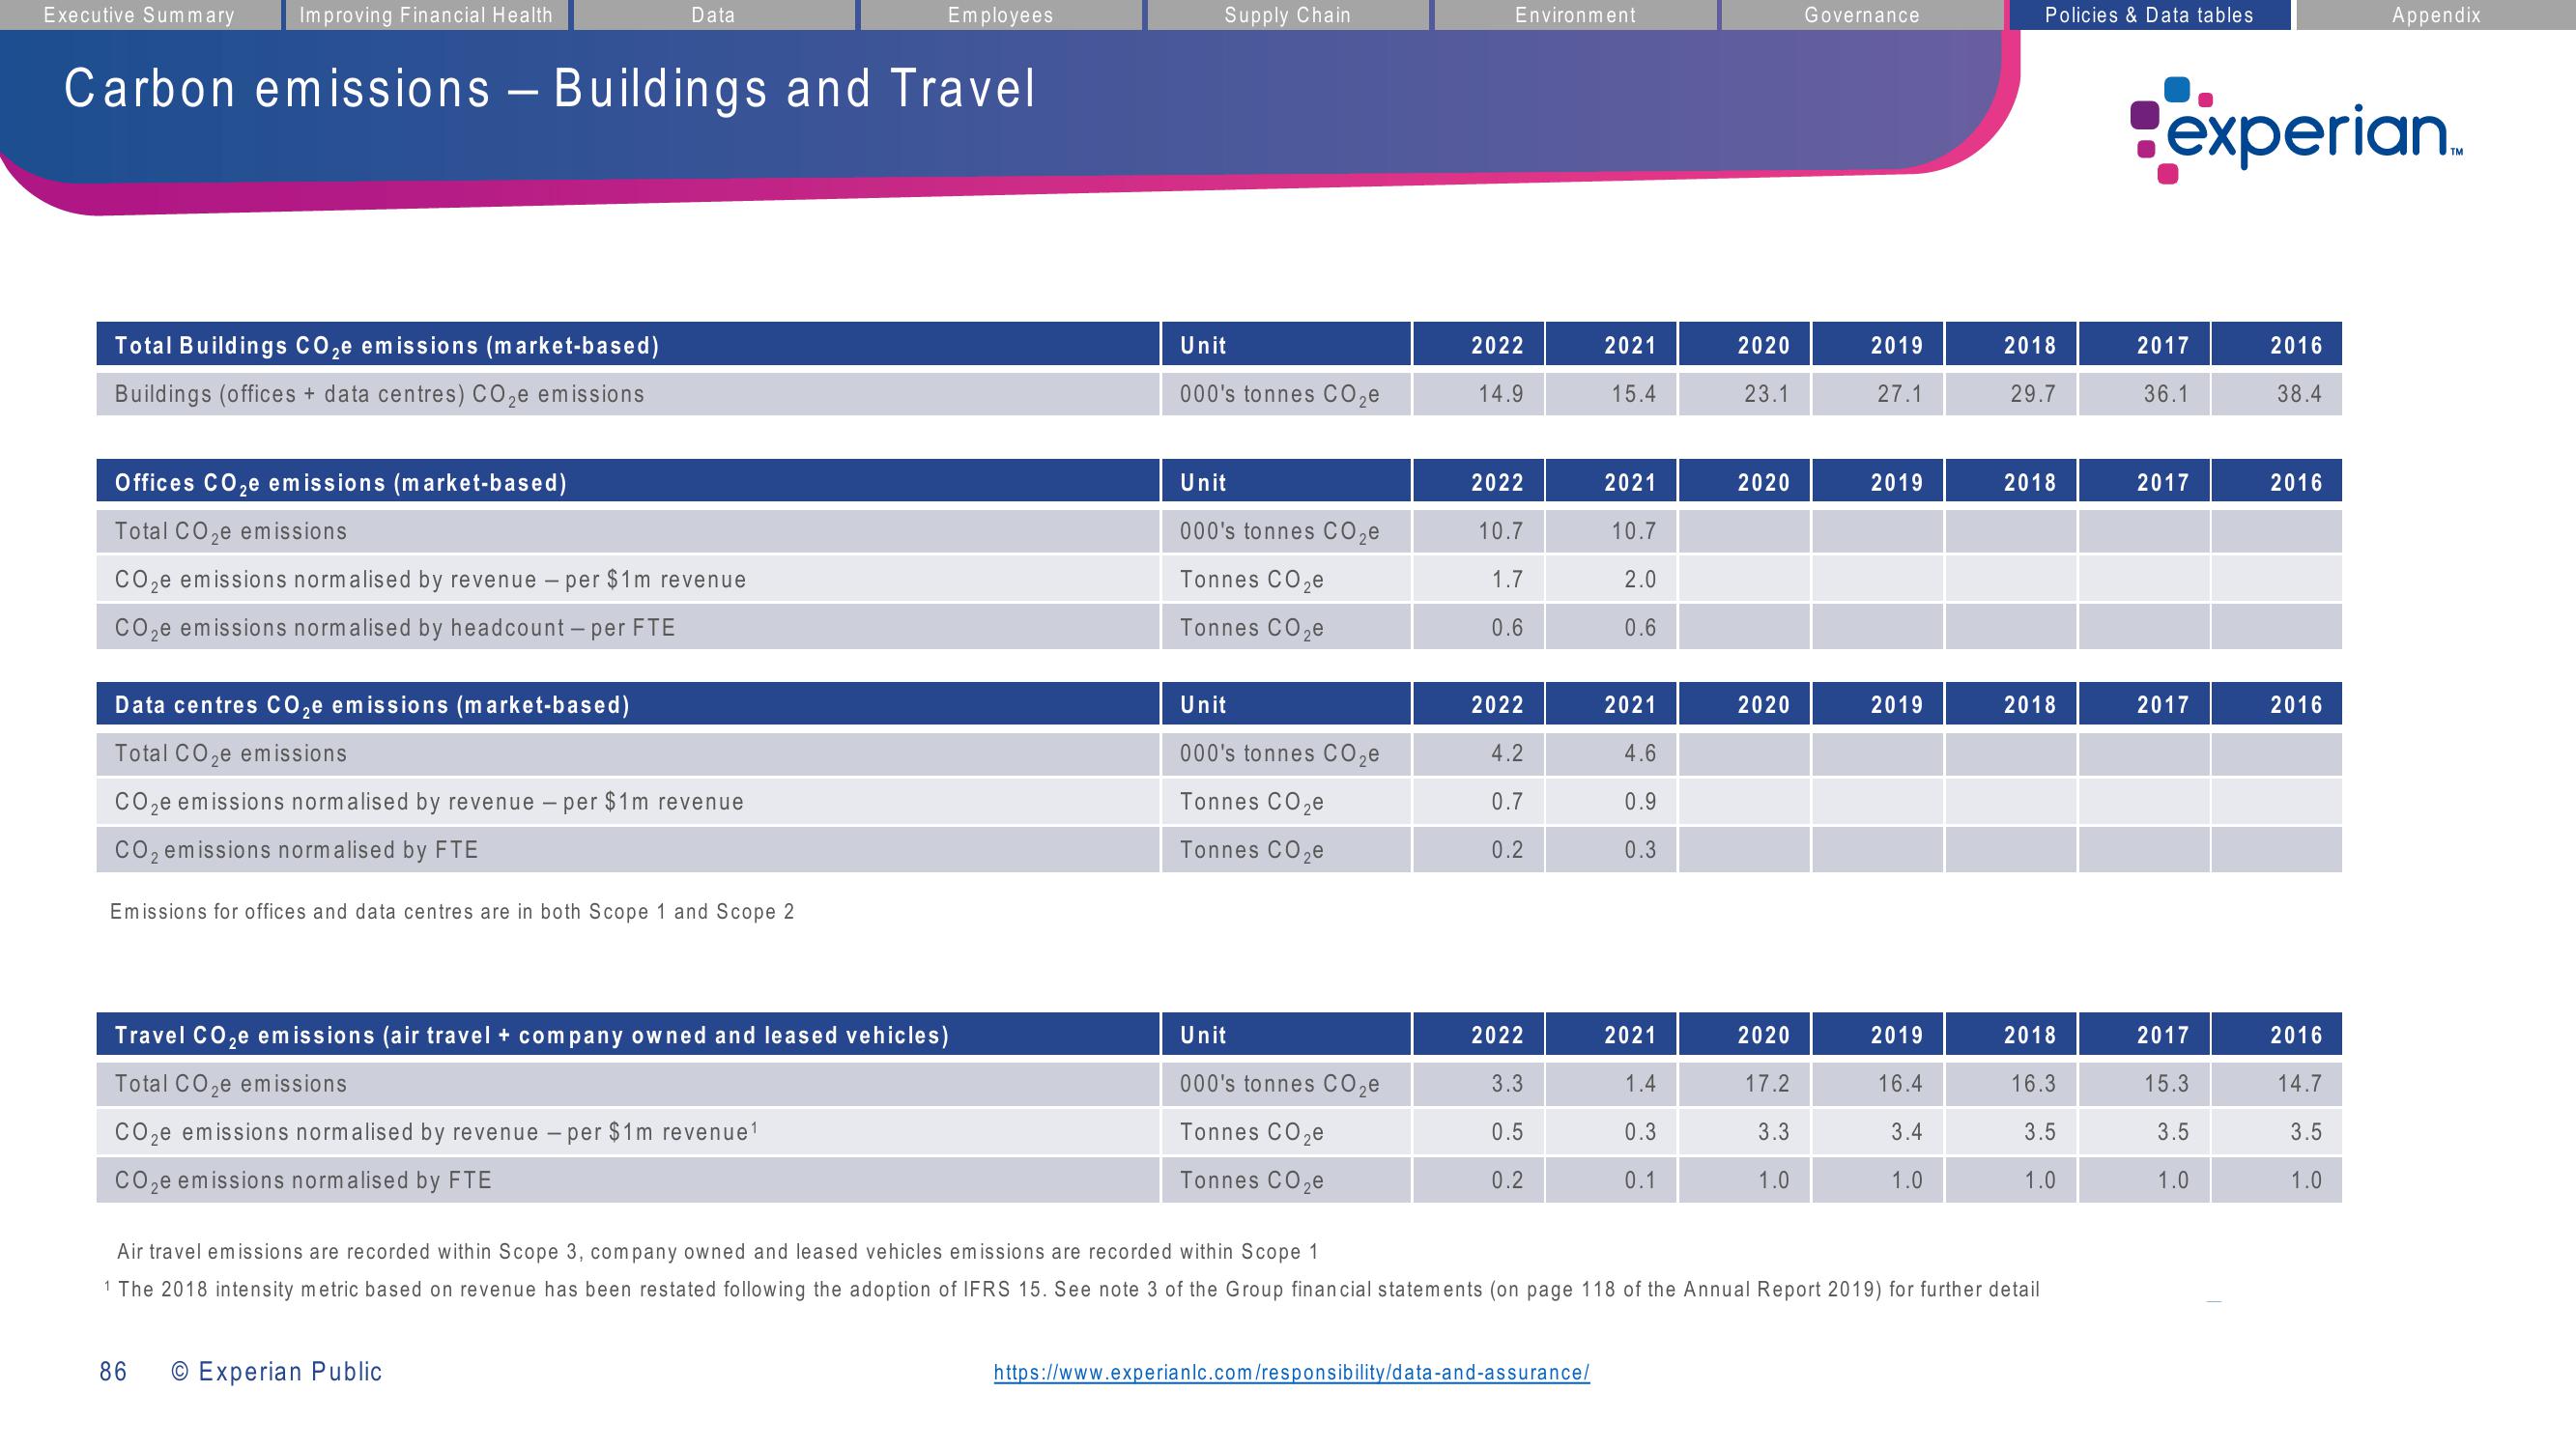
Carbon emissions - Buildings and Travel
Total Buildings CO₂e emissions (market-based)
Buildings (offices + data centres) CO₂ emissions
Data
Offices CO₂e emissions (market-based)
Total CO₂e emissions
CO₂e emissions normalised by revenue - per $1m revenue
CO₂e emissions normalised by headcount - per FTE
Data centres CO₂e emissions (market-based)
Total CO₂e emissions
CO₂e emissions normalised by revenue - per $1m revenue
CO₂ emissions normalised by FTE
Emissions for offices and data centres are in both Scope 1 and Scope 2
Travel CO₂e emissions (air travel company owned and leased vehicles)
Total CO₂e emissions
CO₂e emissions normalised by revenue - per $1m revenue ¹
CO₂e emissions normalised by FTE
86
Employees
O Experian Public
Supply Chain
Unit
000's tonnes CO₂e
Unit
000's tonnes CO₂e
Tonnes CO₂e
Tonnes CO₂e
Unit
000's tonnes CO₂e
Tonnes CO₂e
Tonnes CO₂e
Unit
000's tonnes CO₂e
Tonnes CO₂e
Tonnes CO₂e
Environment
2022
14.9
2022
10.7
1.7
0.6
2022
4.2
0.7
0.2
2022
3.3
0.5
0.2
2021
15.4
https://www.experianlc.com/responsibility/data-and-assurance/
2021
10.7
2.0
0.6
2021
4.6
0.9
0.3
2021
1.4
0.3
0.1
2020
23.1
2020
2020
2020
17.2
3.3
1.0
Governance
2019
27.1
2019
2019
2019
16.4
3.4
1.0
Policies & Data tables
2018
29.7
Air travel emissions are recorded within Scope 3, company owned and leased vehicles emissions are recorded within Scope 1
1 The 2018 intensity metric based on revenue has been restated following the adoption of IFRS 15. See note 3 of the Group financial statements (on page 118 of the Annual Report 2019) for further detail
2018
2018
2018
16.3
3.5
1.0
experian
2017
36.1
2017
2017
2017
15.3
3.5
1.0
2016
38.4
2016
2016
Appendix
2016
14.7
3.5
1.0
TMView entire presentation