3Q24 Investor Update
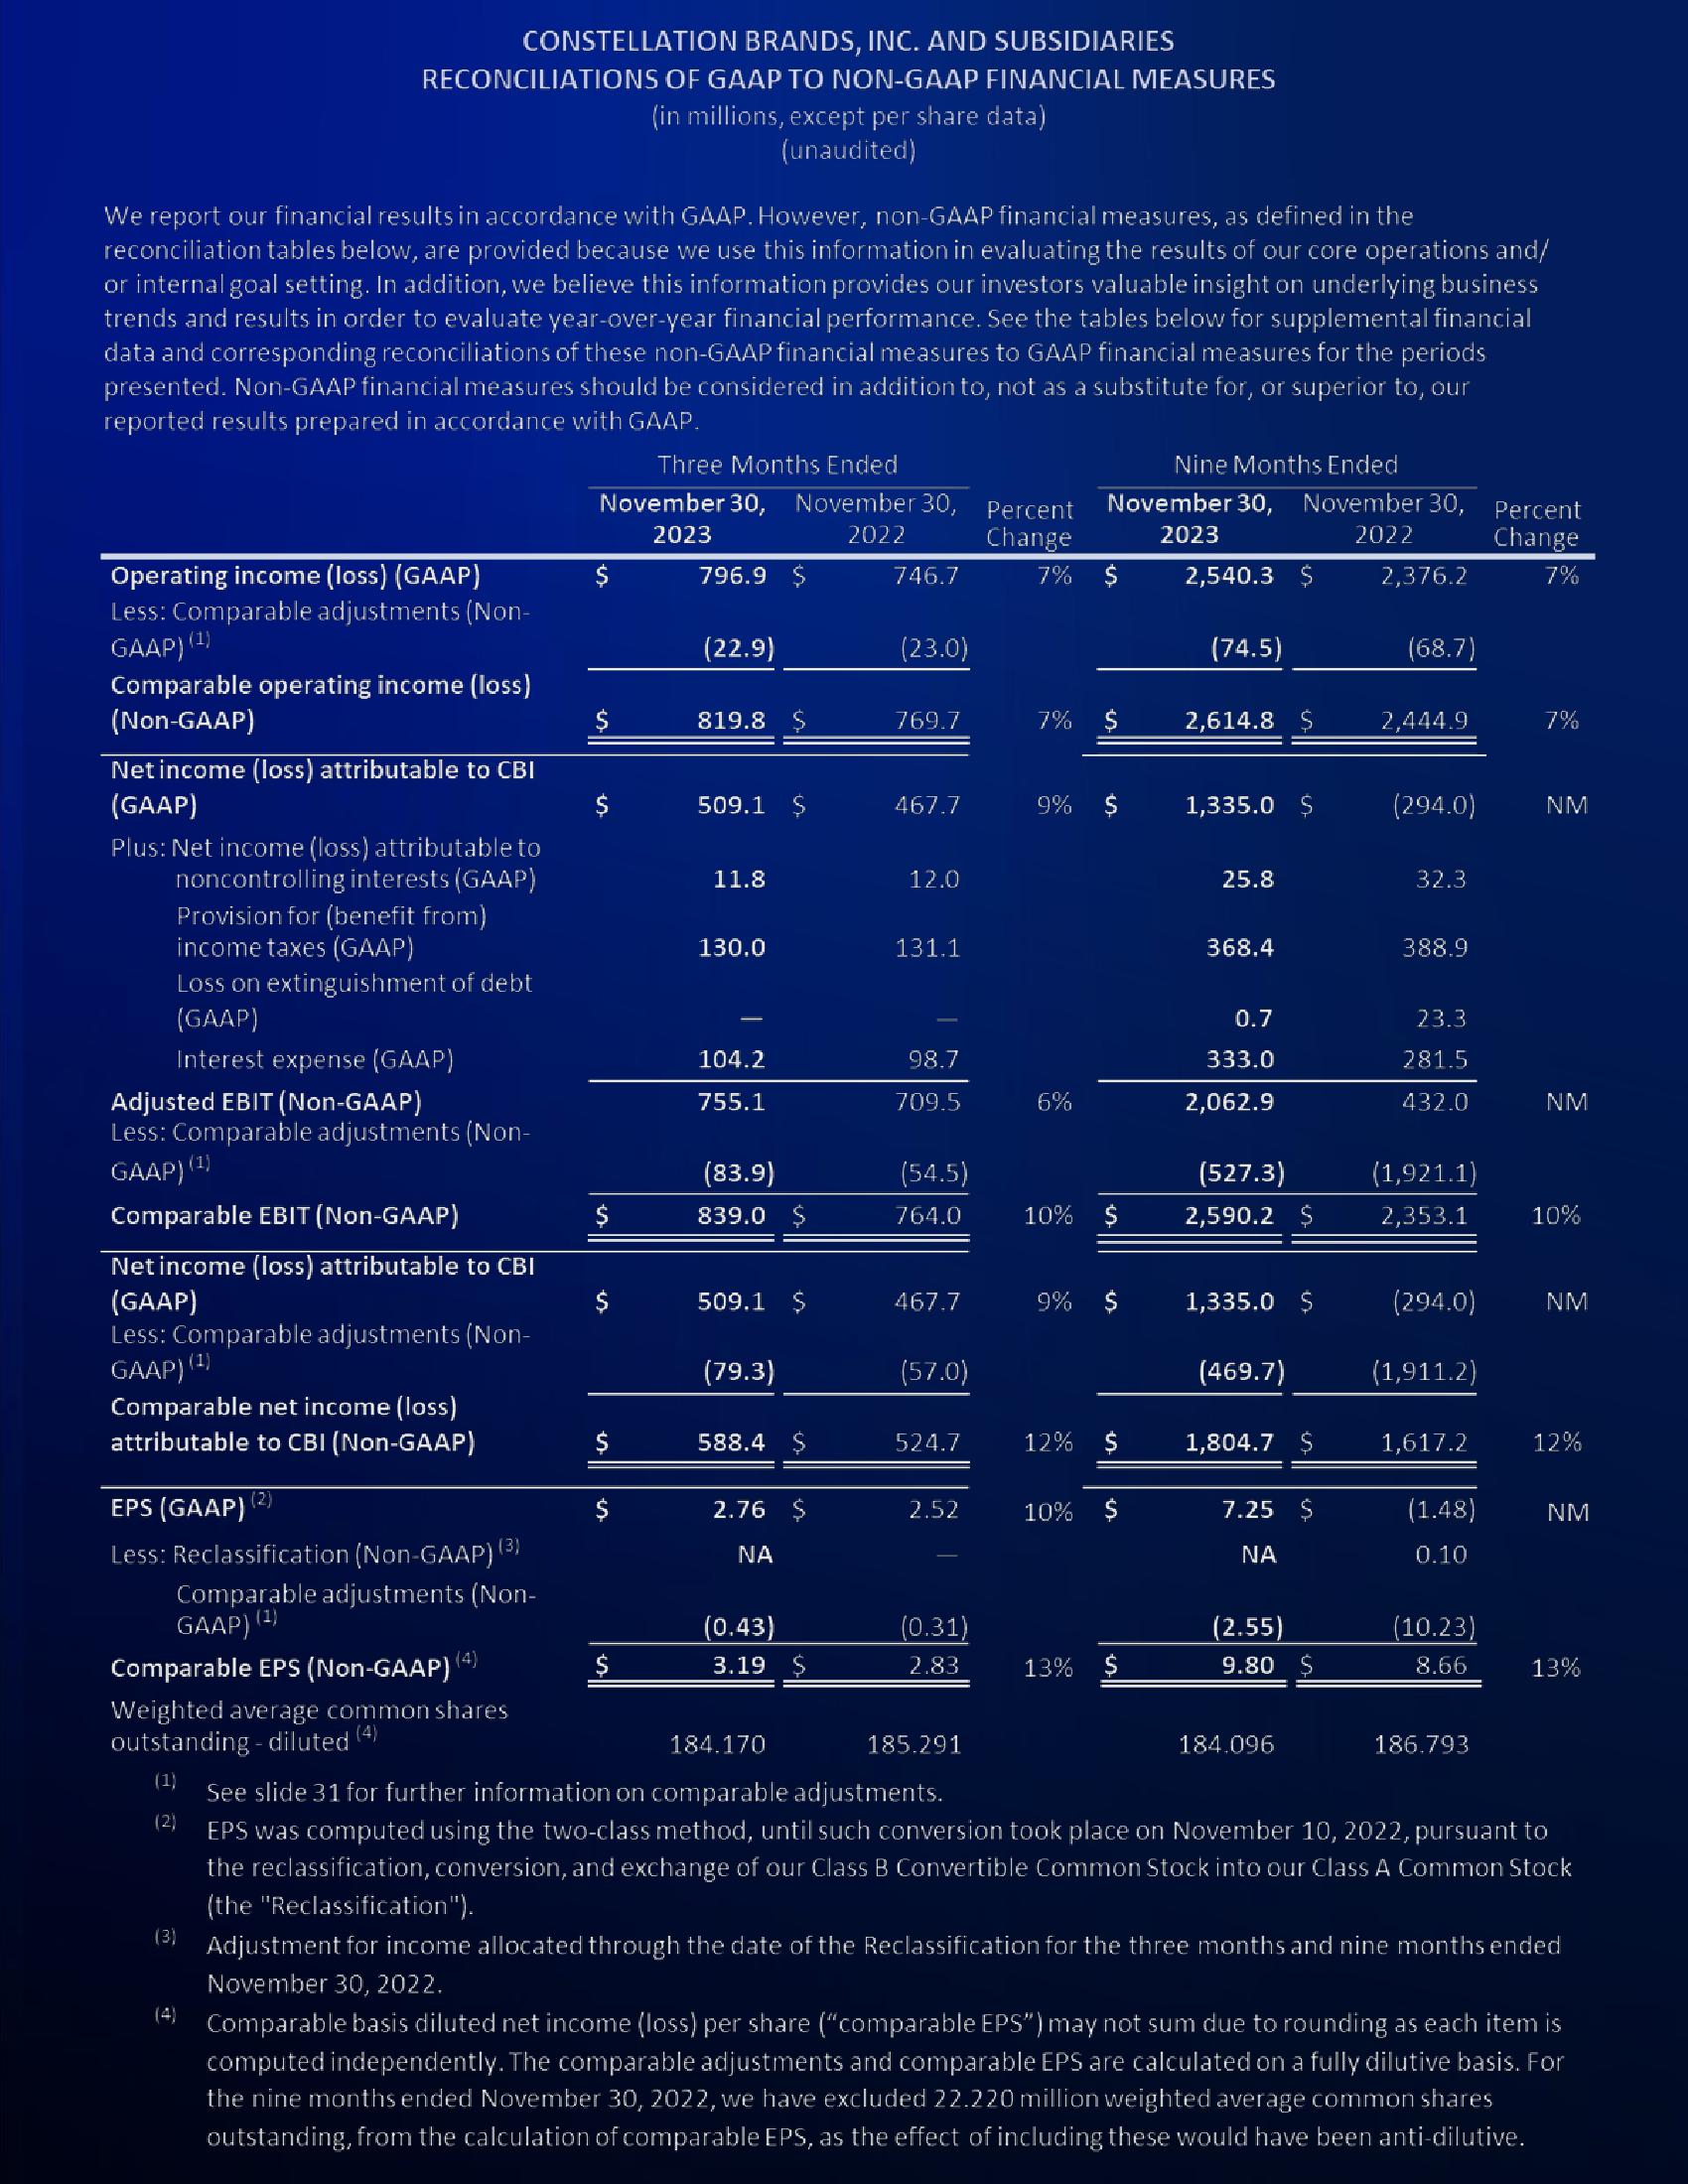
CONSTELLATION BRANDS, INC. AND SUBSIDIARIES
RECONCILIATIONS OF GAAP TO NON-GAAP FINANCIAL MEASURES
(in millions, except per share data)
(unaudited)
We report our financial results in accordance with GAAP. However, non-GAAP financial measures, as defined in the
reconciliation tables below, are provided because we use this information in evaluating the results of our core operations and/
or internal goal setting. In addition, we believe this information provides our investors valuable insight on underlying business
trends and results in order to evaluate year-over-year financial performance. See the tables below for supplemental financial
data and corresponding reconciliations of these non-GAAP financial measures to GAAP financial measures for the periods
presented. Non-GAAP financial measures should be considered in addition to, not as a substitute for, or superior to, our
reported results prepared in accordance with GAAP.
Operating income (loss) (GAAP)
Less: Comparable adjustments (Non-
GAAP) (¹)
Comparable operating income (loss)
(Non-GAAP)
Net income (loss) attributable to CBI
(GAAP)
Plus: Net income (loss) attributable to
noncontrolling interests (GAAP)
Provision for (benefit from)
income taxes (GAAP)
Loss on extinguishment of debt
(GAAP)
Interest expense (GAAP)
Adjusted EBIT (Non-GAAP)
Less: Comparable adjustments (Non-
GAAP) (¹)
Comparable EBIT (Non-GAAP)
Net income (loss) attributable to CBI
(GAAP)
Less: Comparable adjustments (Non-
GAAP) (¹)
Comparable net income (loss)
attributable to CBI (Non-GAAP)
EPS (GAAP) (2)
Less: Reclassification (Non-GAAP) (3)
Comparable adjustments (Non-
(1)
GAAP) (3
Comparable EPS (Non-GAAP) (4)
Weighted average common shares
outstanding-diluted (4)
(1)
(2)
Three Months Ended
November 30, November 30, Percent
2023
2022
Change
7% $
$
S
796.9
(22.9)
819.8 $
509.1 $
11.8
130.0
104.2
755.1
(83.9)
839.0 $
509.1 $
(79.3)
588.4
2.76 $
ΝΑ
(0.43)
3.19
746.7
(23.0)
769.7
467.7
12.0
131.1
98.7
709.5
(54.5)
764.0
467.7
(57.0)
2.52
(0.31)
2.83
7%
185.291
Nine Months Ended
November 30, November 30,
2023
2022
2,540.3 $
2,376.2
9% $
6%
10%
524.7 12% $
$
9% $
10% $
13% $
(74.5)
2,614.8 $
1,335.0 $
25.8
368.4
0.7
333.0
2,062.9
(527.3)
2,590.2 $
1,335.0 $
(469.7)
1,804.7 $
7.25 $
ΝΑ
(2.55)
9.80
(68.7)
184.096
2,444.9
(294.0)
32.3
388.9
23.3
281.5
432.0
(1,921.1)
2,353.1
(294.0)
(1,911.2)
1,617.2
(1.48)
0.10
(10.23)
8.66
Percent
Change
7%
186.793
7%
NM
NM
10%
NM
184.170
See slide 31 for further information on comparable adjustments.
EPS was computed using the two-class method, until such conversion took place on November 10, 2022, pursuant to
the reclassification, conversion, and exchange of our Class B Convertible Common Stock into our Class A Common Stock
(the "Reclassification").
(3) Adjustment for income allocated through the date of the Reclassification for the three months and nine months ended
November 30, 2022.
12%
NM
13%
(4) Comparable basis diluted net income (loss) per share ("comparable EPS") may not sum due to rounding as each item is
computed independently. The comparable adjustments and comparable EPS are calculated on a fully dilutive basis. For
the nine months ended November 30, 2022, we have excluded 22.220 million weighted average common shares
outstanding, from the calculation of comparable EPS, as the effect of including these would have been anti-dilutive.View entire presentation