FAT Brands Results Presentation Deck
CONSOLIDATED STATEMENT OF OPERATIONS
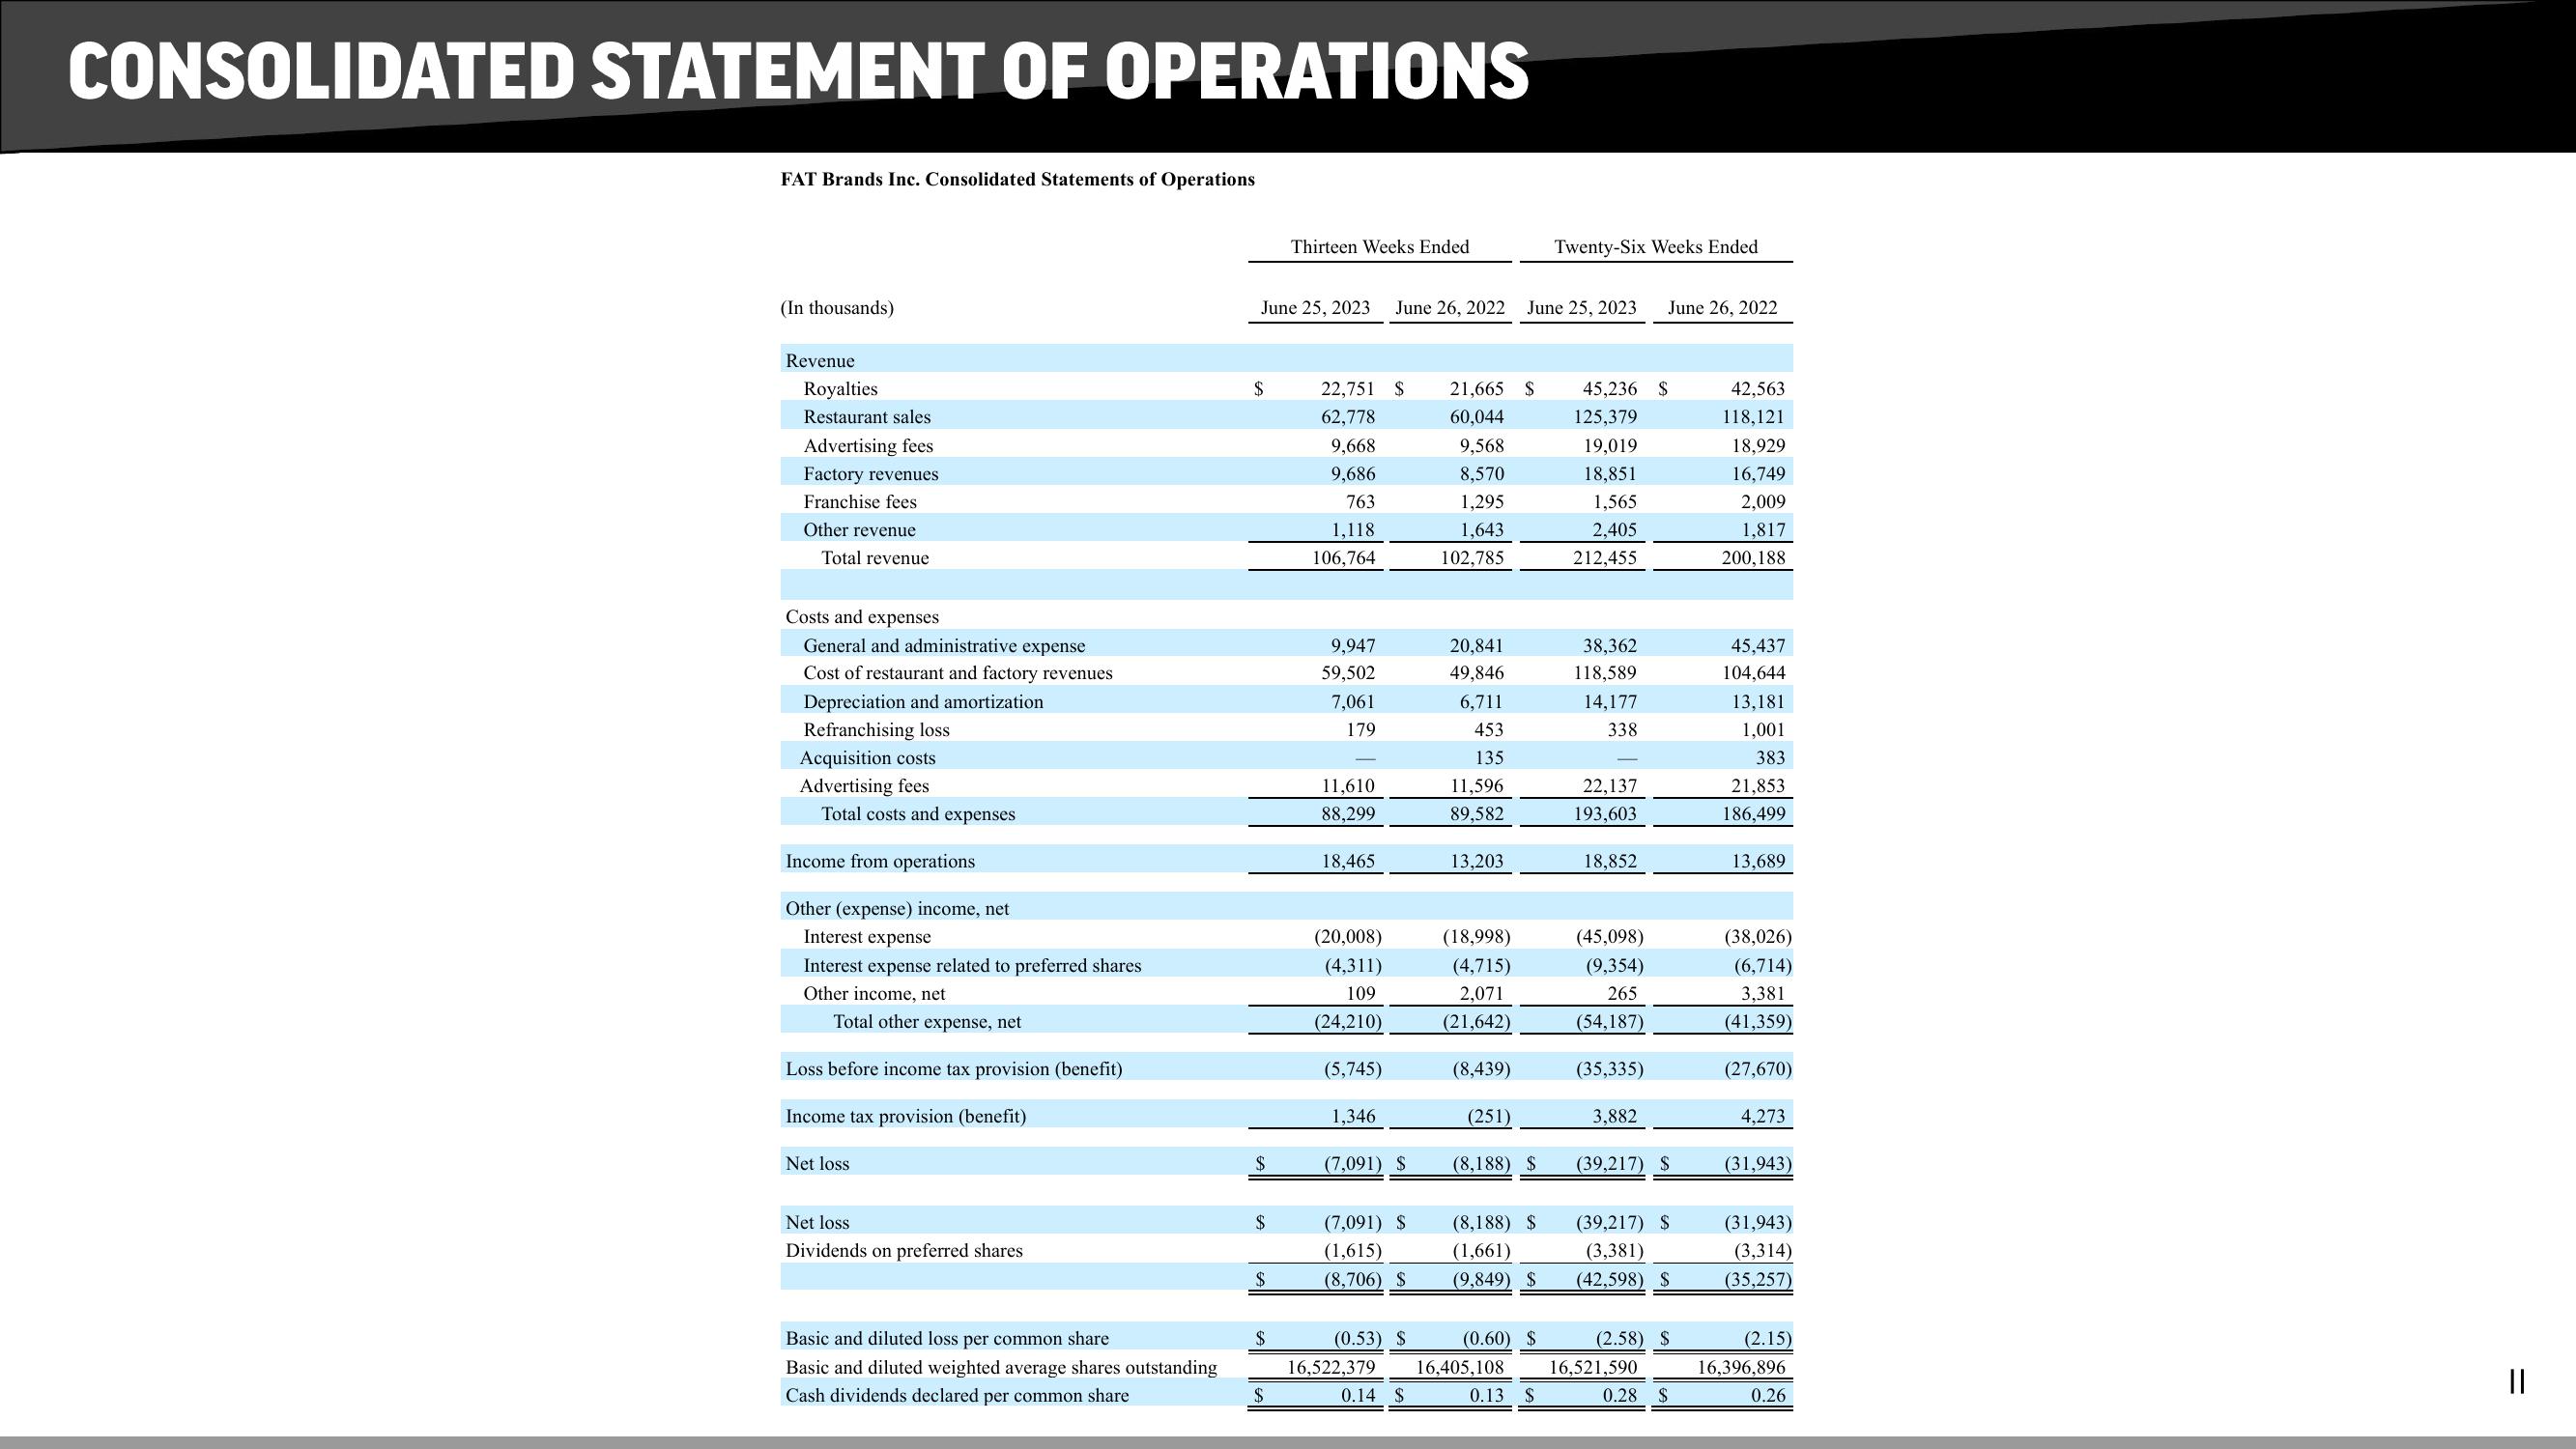
FAT Brands Inc. Consolidated Statements of Operations
(In thousands)
Revenue
Royalties
Restaurant sales
Advertising fees
Factory revenues
Franchise fees
Other revenue
Total revenue
Costs and expenses
General and administrative expense
Cost of restaurant and factory revenues
Depreciation and amortization
Refranchising loss
Acquisition costs
Advertising fees
Total costs and expenses
Income from operations
Other (expense) income, net
Interest expense
Interest expense related to preferred shares
Other income, net
Total other expense, net
Loss before income tax provision (benefit)
Income tax provision (benefit)
Net loss
Net loss
Dividends on preferred shares
Basic and diluted loss per common share
Basic and diluted weighted average shares outstanding
Cash dividends declared per common share
June 25, 2023
$
$
$
$
$
Thirteen Weeks Ended
$
22,751 $
62,778
9,668
9,686
763
1,118
106,764
9,947
59,502
7,061
179
11,610
88,299
18,465
(20,008)
(4,311)
109
(24,210)
(5,745)
June 26, 2022
1,346
(7,091) S
(7,091) $
(1,615)
(8,706) $
(0.53) S
16,522,379
0.14 $
21,665 $
60,044
9,568
8,570
1,295
1,643
102,785
20,841
49,846
6,711
453
135
11,596
89,582
13,203
(18,998)
(4,715)
2,071
(21,642)
(8,439)
(251)
June 25, 2023
(8,188) $
(8,188) $
(1,661)
(9,849) $
Twenty-Six Weeks Ended
(0.60) $
16,405,108
0.13 $
45,236 $
125,379
19,019
18,851
1,565
2,405
212,455
38,362
118,589
14,177
338
22,137
193,603
18,852
(45,098)
(9,354)
265
(54,187)
(35,335)
June 26, 2022
3,882
(39,217) $
(39,217) $
(3,381)
(42,598) $
(2.58) $
16,521,590
0.28 $
42,563
118,121
18,929
16,749
2,009
1,817
200,188
45,437
104,644
13,181
1,001
383
21,853
186,499
13,689
(38,026)
(6,714)
3,381
(41,359)
(27,670)
4,273
(31,943)
(31,943)
(3,314)
(35,257)
(2.15)
16,396,896
0.26
||View entire presentation