Crocs Investor Presentation Deck
NON-GAAP RECONCILIATION (CONT'D)
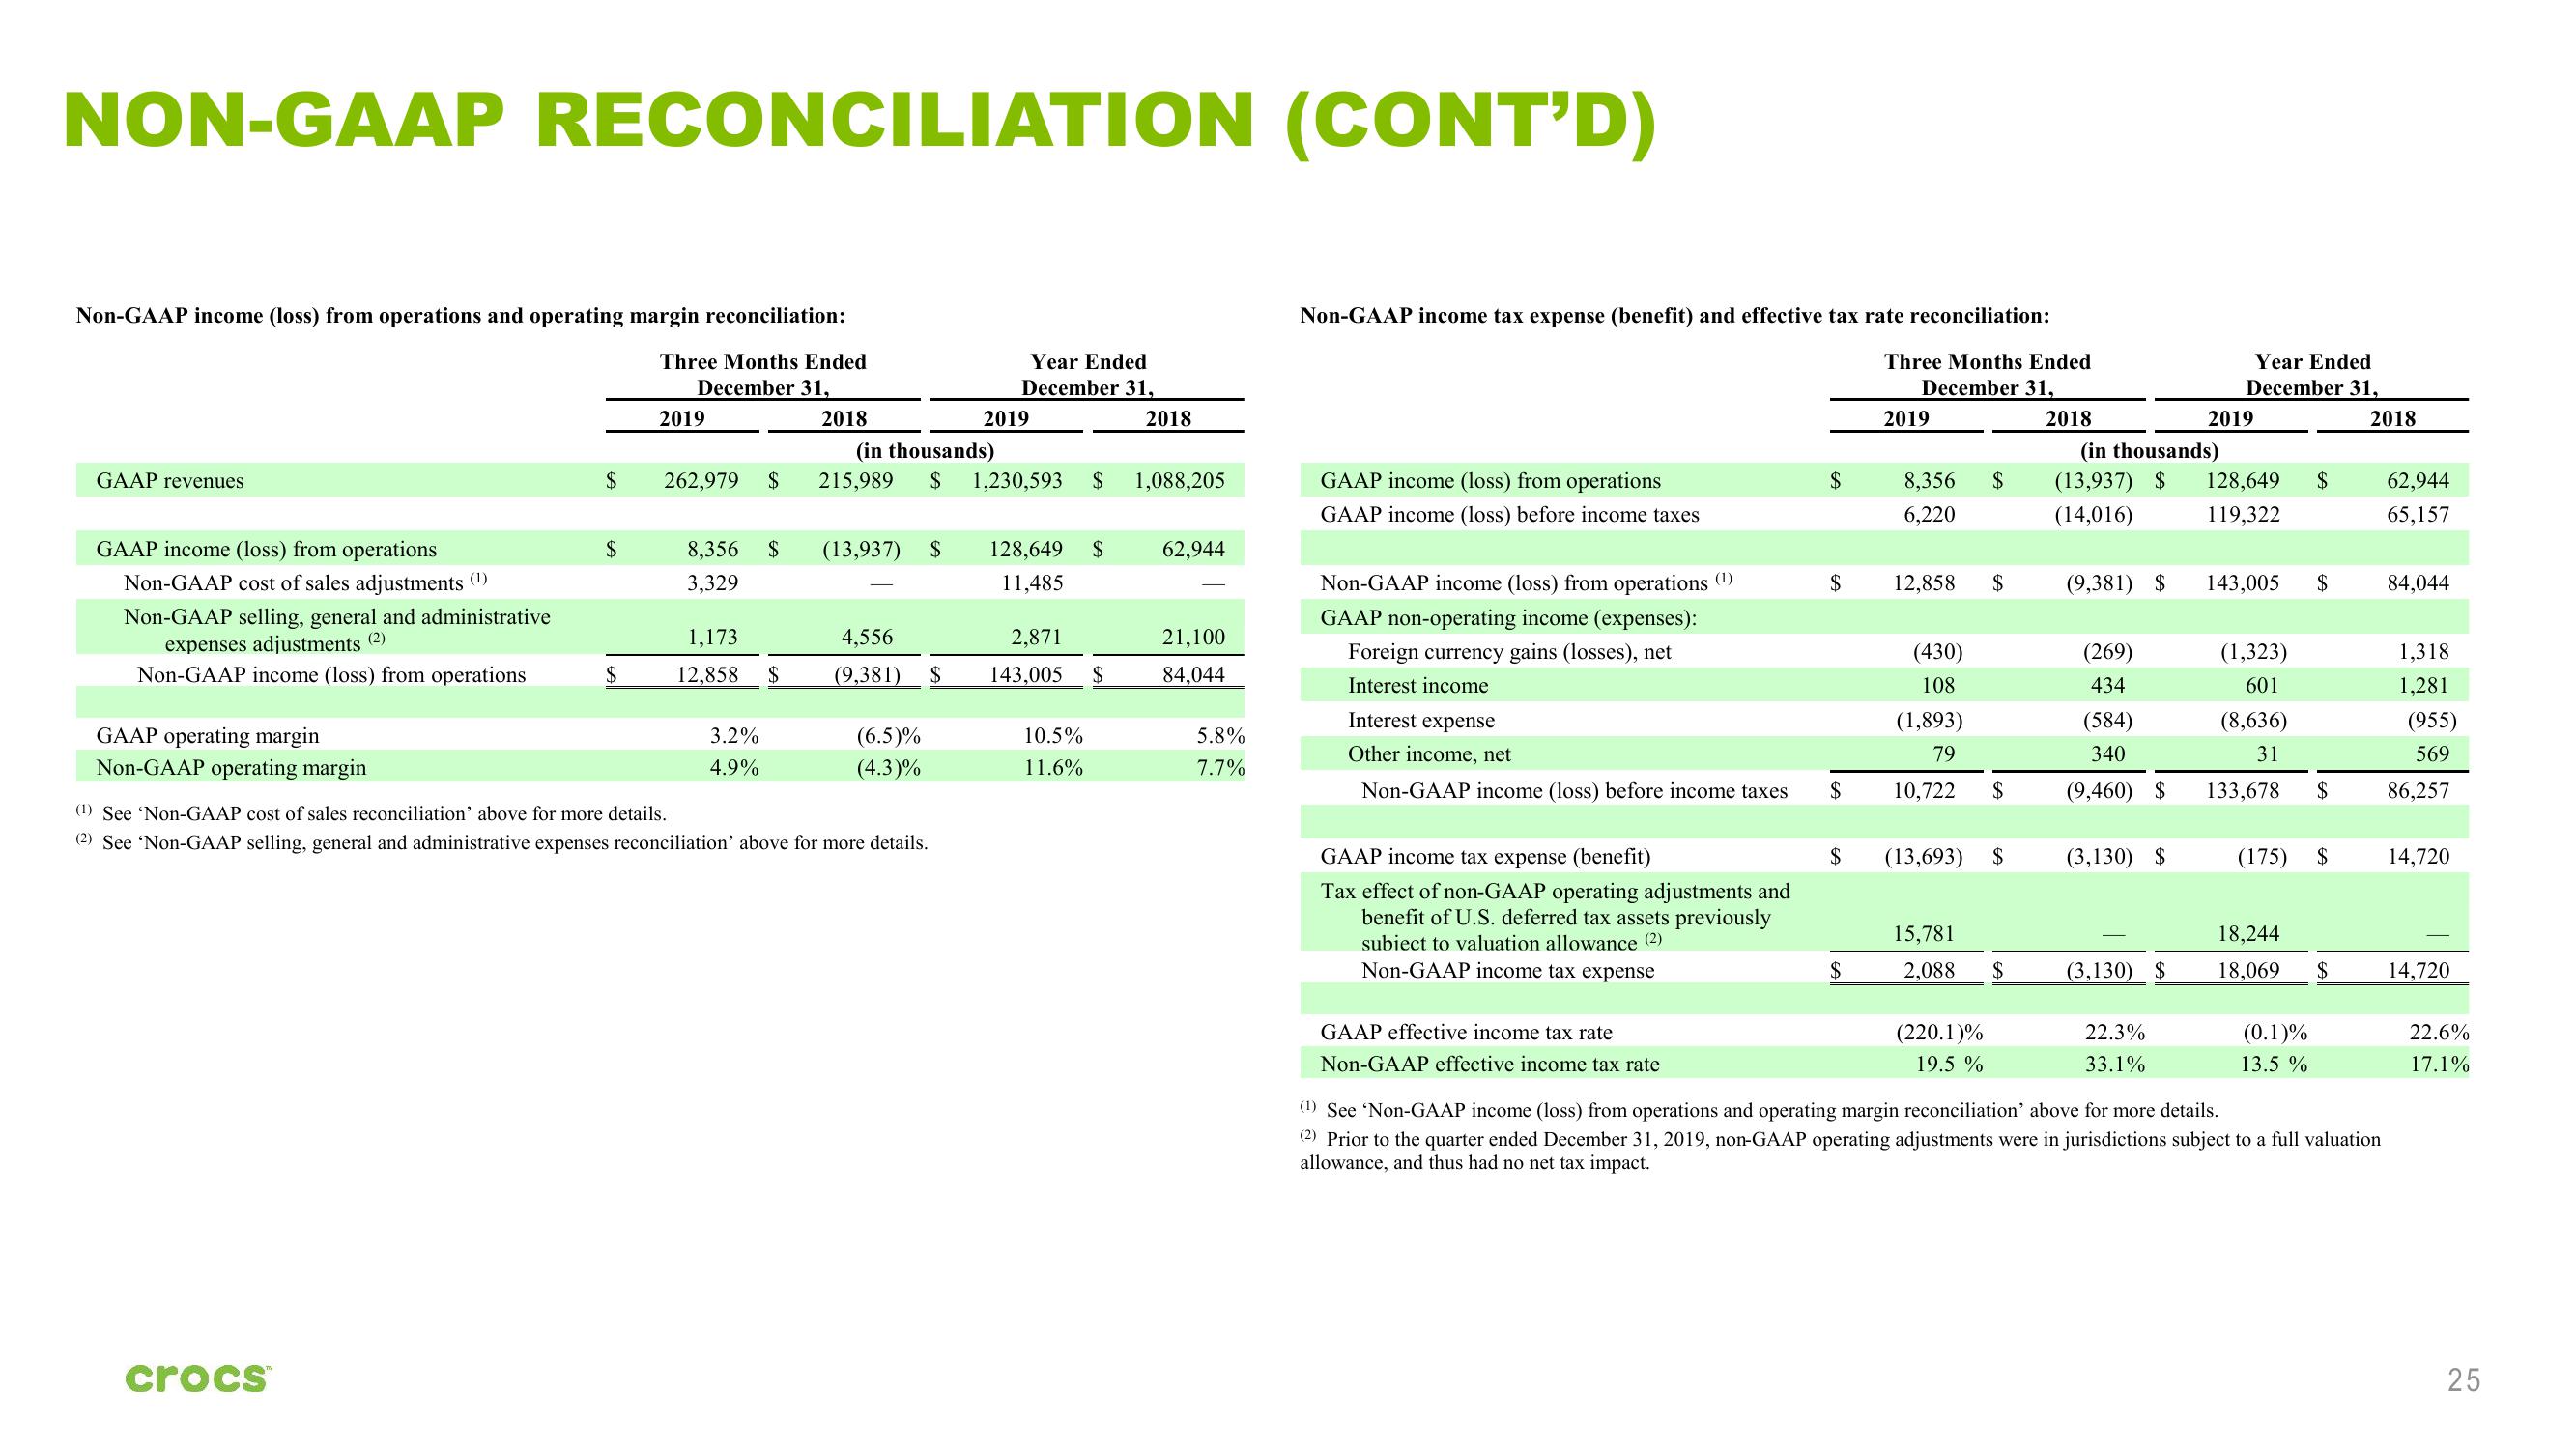
Non-GAAP income (loss) from operations and operating margin reconciliation:
Three Months Ended
December 31,
GAAP revenues
GAAP income (loss) from operations
Non-GAAP cost of sales adjustments (¹)
Non-GAAP selling, general and administrative
expenses adjustments (2)
Non-GAAP income (loss) from operations
GAAP operating margin
Non-GAAP operating margin
$
crocs™
$
$
2019
262,979 $
8,356
3,329
1,173
12,858
3.2%
4.9%
$
$
2018
(13,937)
(in thousands)
215,989 $ 1,230,593 $ 1,088,205
4,556
(9,381) $
(6.5)%
(4.3)%
Year Ended
December 31,
(1) See 'Non-GAAP cost of sales reconciliation' above for more details.
(2) See 'Non-GAAP selling, general and administrative expenses reconciliation' above for more details.
2019
$ 128,649 $
11,485
2,871
143,005 $
2018
10.5%
11.6%
62,944
21,100
84,044
5.8%
7.7%
Non-GAAP income tax expense (benefit) and effective tax rate reconciliation:
Three Months Ended
December 31,
GAAP income (loss) from operations
GAAP income (loss) before income taxes
Non-GAAP income (loss) from operations (¹)
GAAP non-operating income (expenses):
Foreign currency gains (losses), net
Interest income
Interest expense
Other income, net
Non-GAAP income (loss) before income taxes
GAAP income tax expense (benefit)
Tax effect of non-GAAP operating adjustments and
benefit of U.S. deferred tax assets previously
subiect to valuation allowance (2)
Non-GAAP income tax expense
GAAP effective income tax rate
Non-GAAP effective income tax rate
$
$
$
$
$
2019
8,356 $
6,220
12,858
(430)
108
(1,893)
79
10,722
(13,693)
$
(220.1)%
19.5%
$
$
15,781
2,088 $
2018
(in thousands)
(13,937) $
(14,016)
(9,381) $
(269)
434
(584)
340
(9,460) $
(3,130) $
(3,130) $
22.3%
33.1%
Year Ended
December 31,
2019
128,649 $
119,322
143,005
$
(1,323)
601
(8,636)
31
133,678 $
(175) $
18,244
18,069 $
(0.1)%
13.5 %
2018
(¹) See 'Non-GAAP income (loss) from operations and operating margin reconciliation' above for more details.
(2) Prior to the quarter ended December 31, 2019, non-GAAP operating adjustments were in jurisdictions subject to a full valuation
allowance, and thus had no net tax impact.
62,944
65,157
84,044
1,318
1,281
(955)
569
86,257
14,720
14,720
22.6%
17.1%
25View entire presentation