Kinnevik Results Presentation Deck slide image

Kinnevik Results Presentation Deck

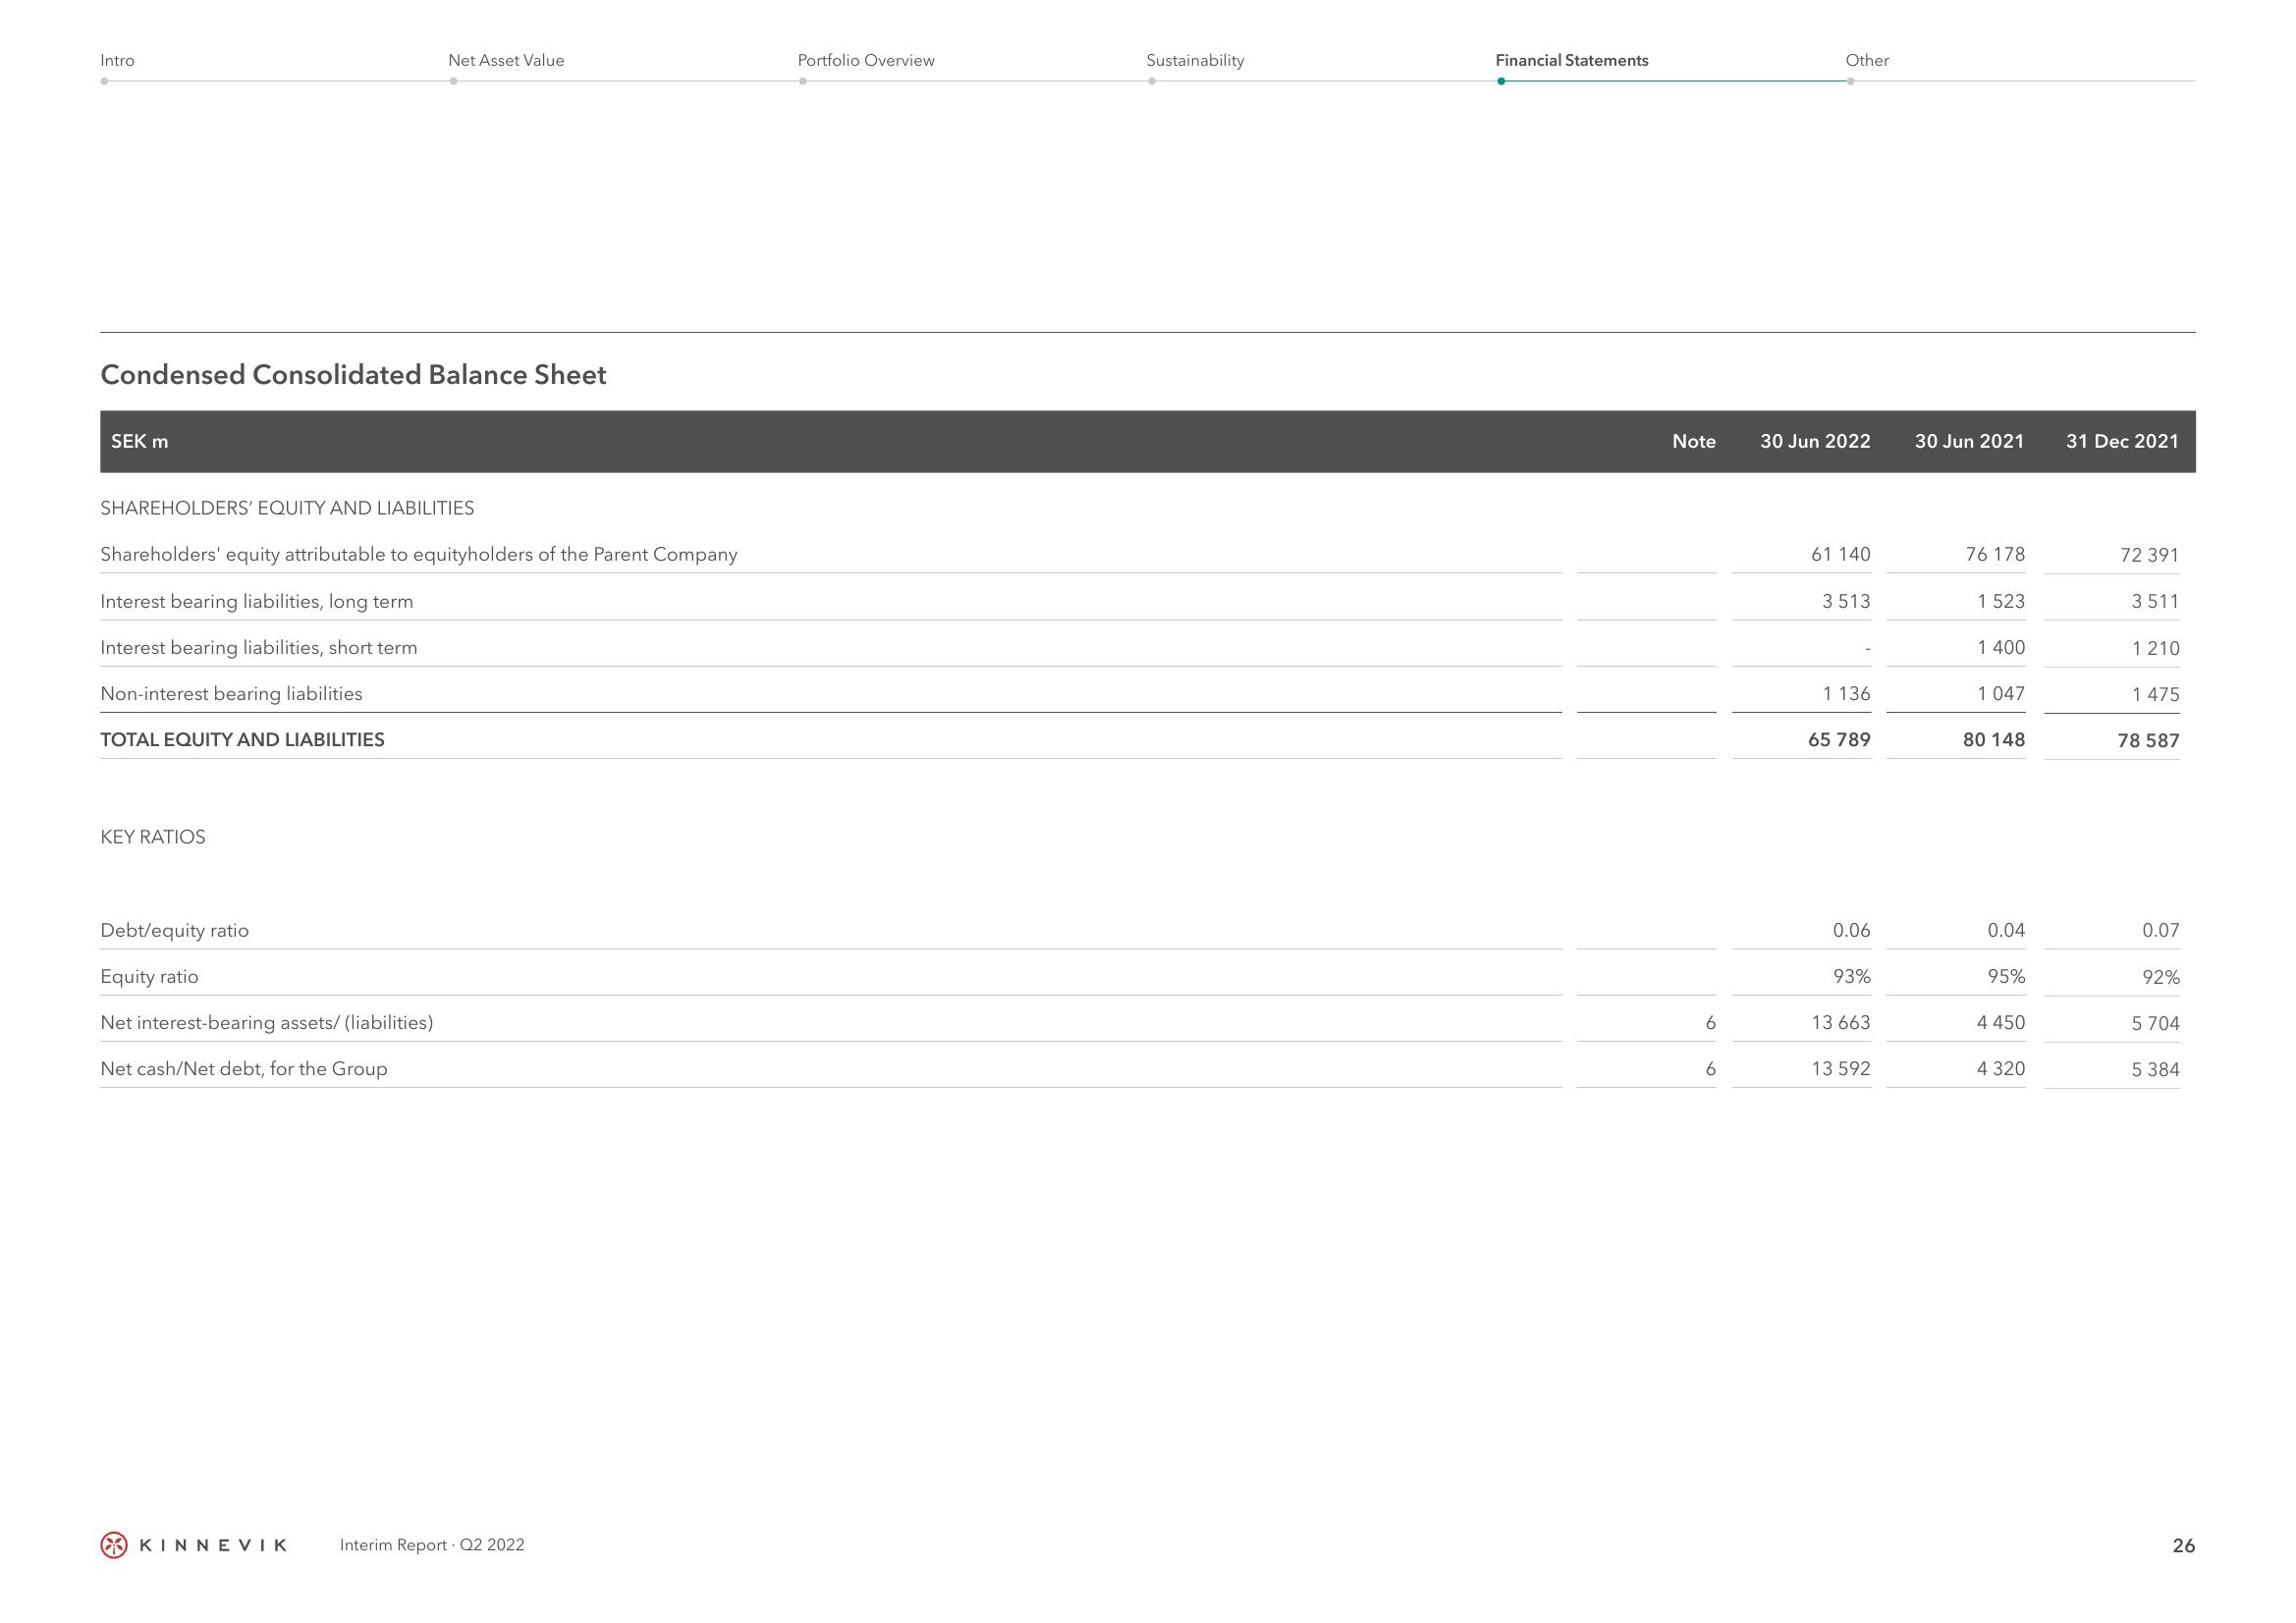
Intro Condensed Consolidated Balance Sheet SEK m SHAREHOLDERS' EQUITY AND LIABILITIES Shareholders' equity attributable to equityholders of the Parent Company Interest bearing liabilities, long term Interest bearing liabilities, short term Non-interest bearing liabilities TOTAL EQUITY AND LIABILITIES KEY RATIOS Net Asset Value Debt/equity ratio Equity ratio Net interest-bearing assets/ (liabilities) Net cash/Net debt, for the Group KINNEVIK Interim Report. Q2 2022 Portfolio Overview Sustainability Financial Statements Note 6 6 Other 30 Jun 2022 61 140 3513 1 136 65 789 0.06 93% 13 663 13 592 30 Jun 2021 76 178 1 523 1 400 1 047 80 148 0.04 95% 4 450 4 320 31 Dec 2021 72 391 3511 1210 1 475 78 587 0.07 92% 5 704 5 384 26
View entire presentation