Freightos SPAC Presentation Deck
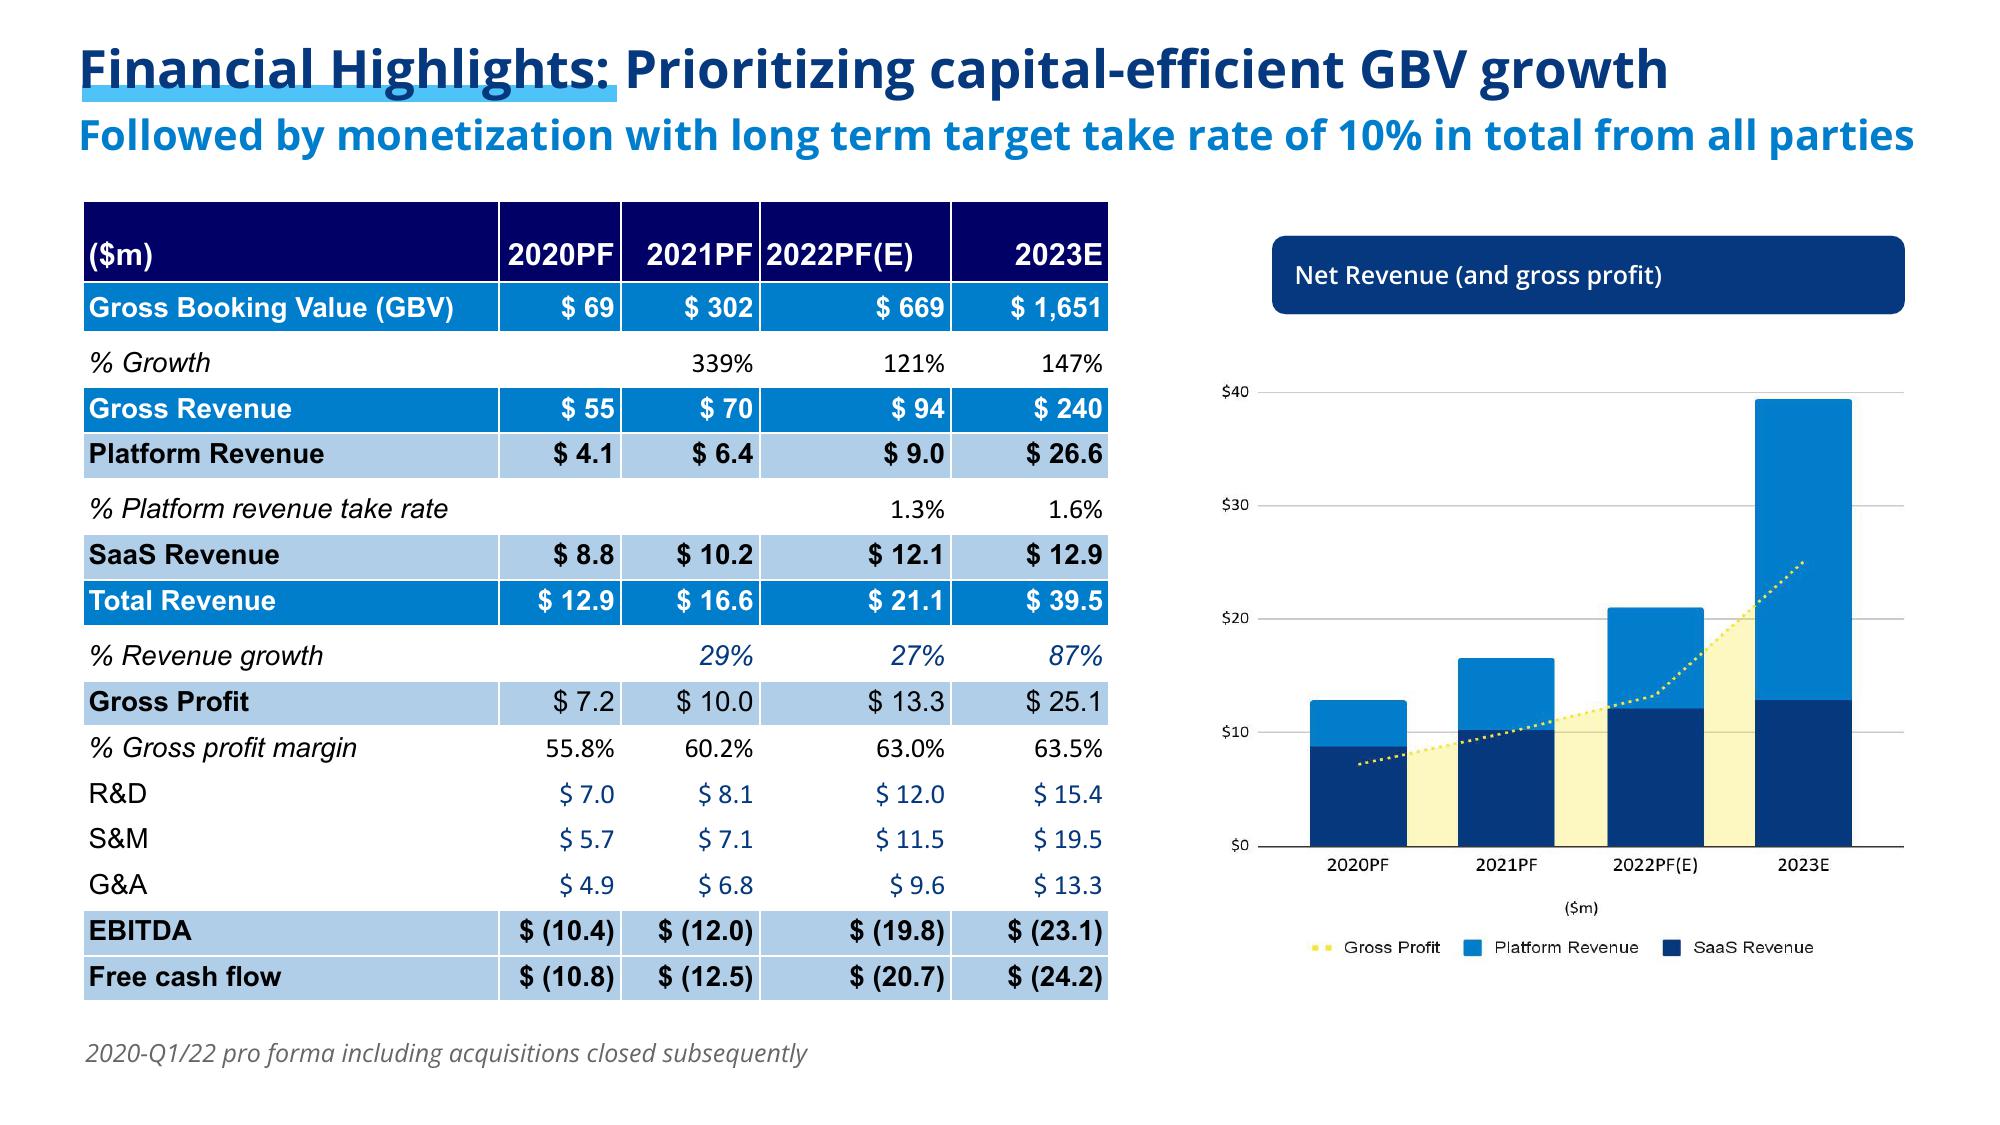
Financial Highlights: Prioritizing capital-efficient GBV growth
Followed by monetization with long term target take rate of 10% in total from all parties
($m)
Gross Booking Value (GBV)
% Growth
Gross Revenue
Platform Revenue
% Platform revenue take rate
SaaS Revenue
Total Revenue
% Revenue growth
Gross Profit
% Gross profit margin
R&D
S&M
G&A
EBITDA
Free cash flow
2020PF 2021PF 2022PF(E)
$69
$ 302
$55
$4.1
$8.8
$12.9
339%
$70
$ 6.4
$ 10.2
$16.6
29%
$7.2
$10.0
55.8%
60.2%
$7.0
$8.1
$5.7
$7.1
$ 4.9
$6.8
$ (10.4)
$ (12.0)
$ (10.8) $ (12.5)
2020-Q1/22 pro forma including acquisitions closed subsequently
$ 669
121%
$94
$9.0
1.3%
$ 12.1
$ 21.1
27%
$13.3
63.0%
$ 12.0
$11.5
$9.6
$ (19.8)
$ (20.7)
2023E
$ 1,651
147%
$ 240
$ 26.6
1.6%
$ 12.9
$39.5
87%
$ 25.1
63.5%
$15.4
$19.5
$ 13.3
$ (23.1)
$ (24.2)
$40
$30
$20
$10
$0
Net Revenue (and gross profit)
2020PF
Gross Profit
2021PF
($m)
2022PF(E)
Platform Revenue
2023E
SaaS RevenueView entire presentation