Morgan Stanley Investment Banking Pitch Book
●
Project Roosevelt
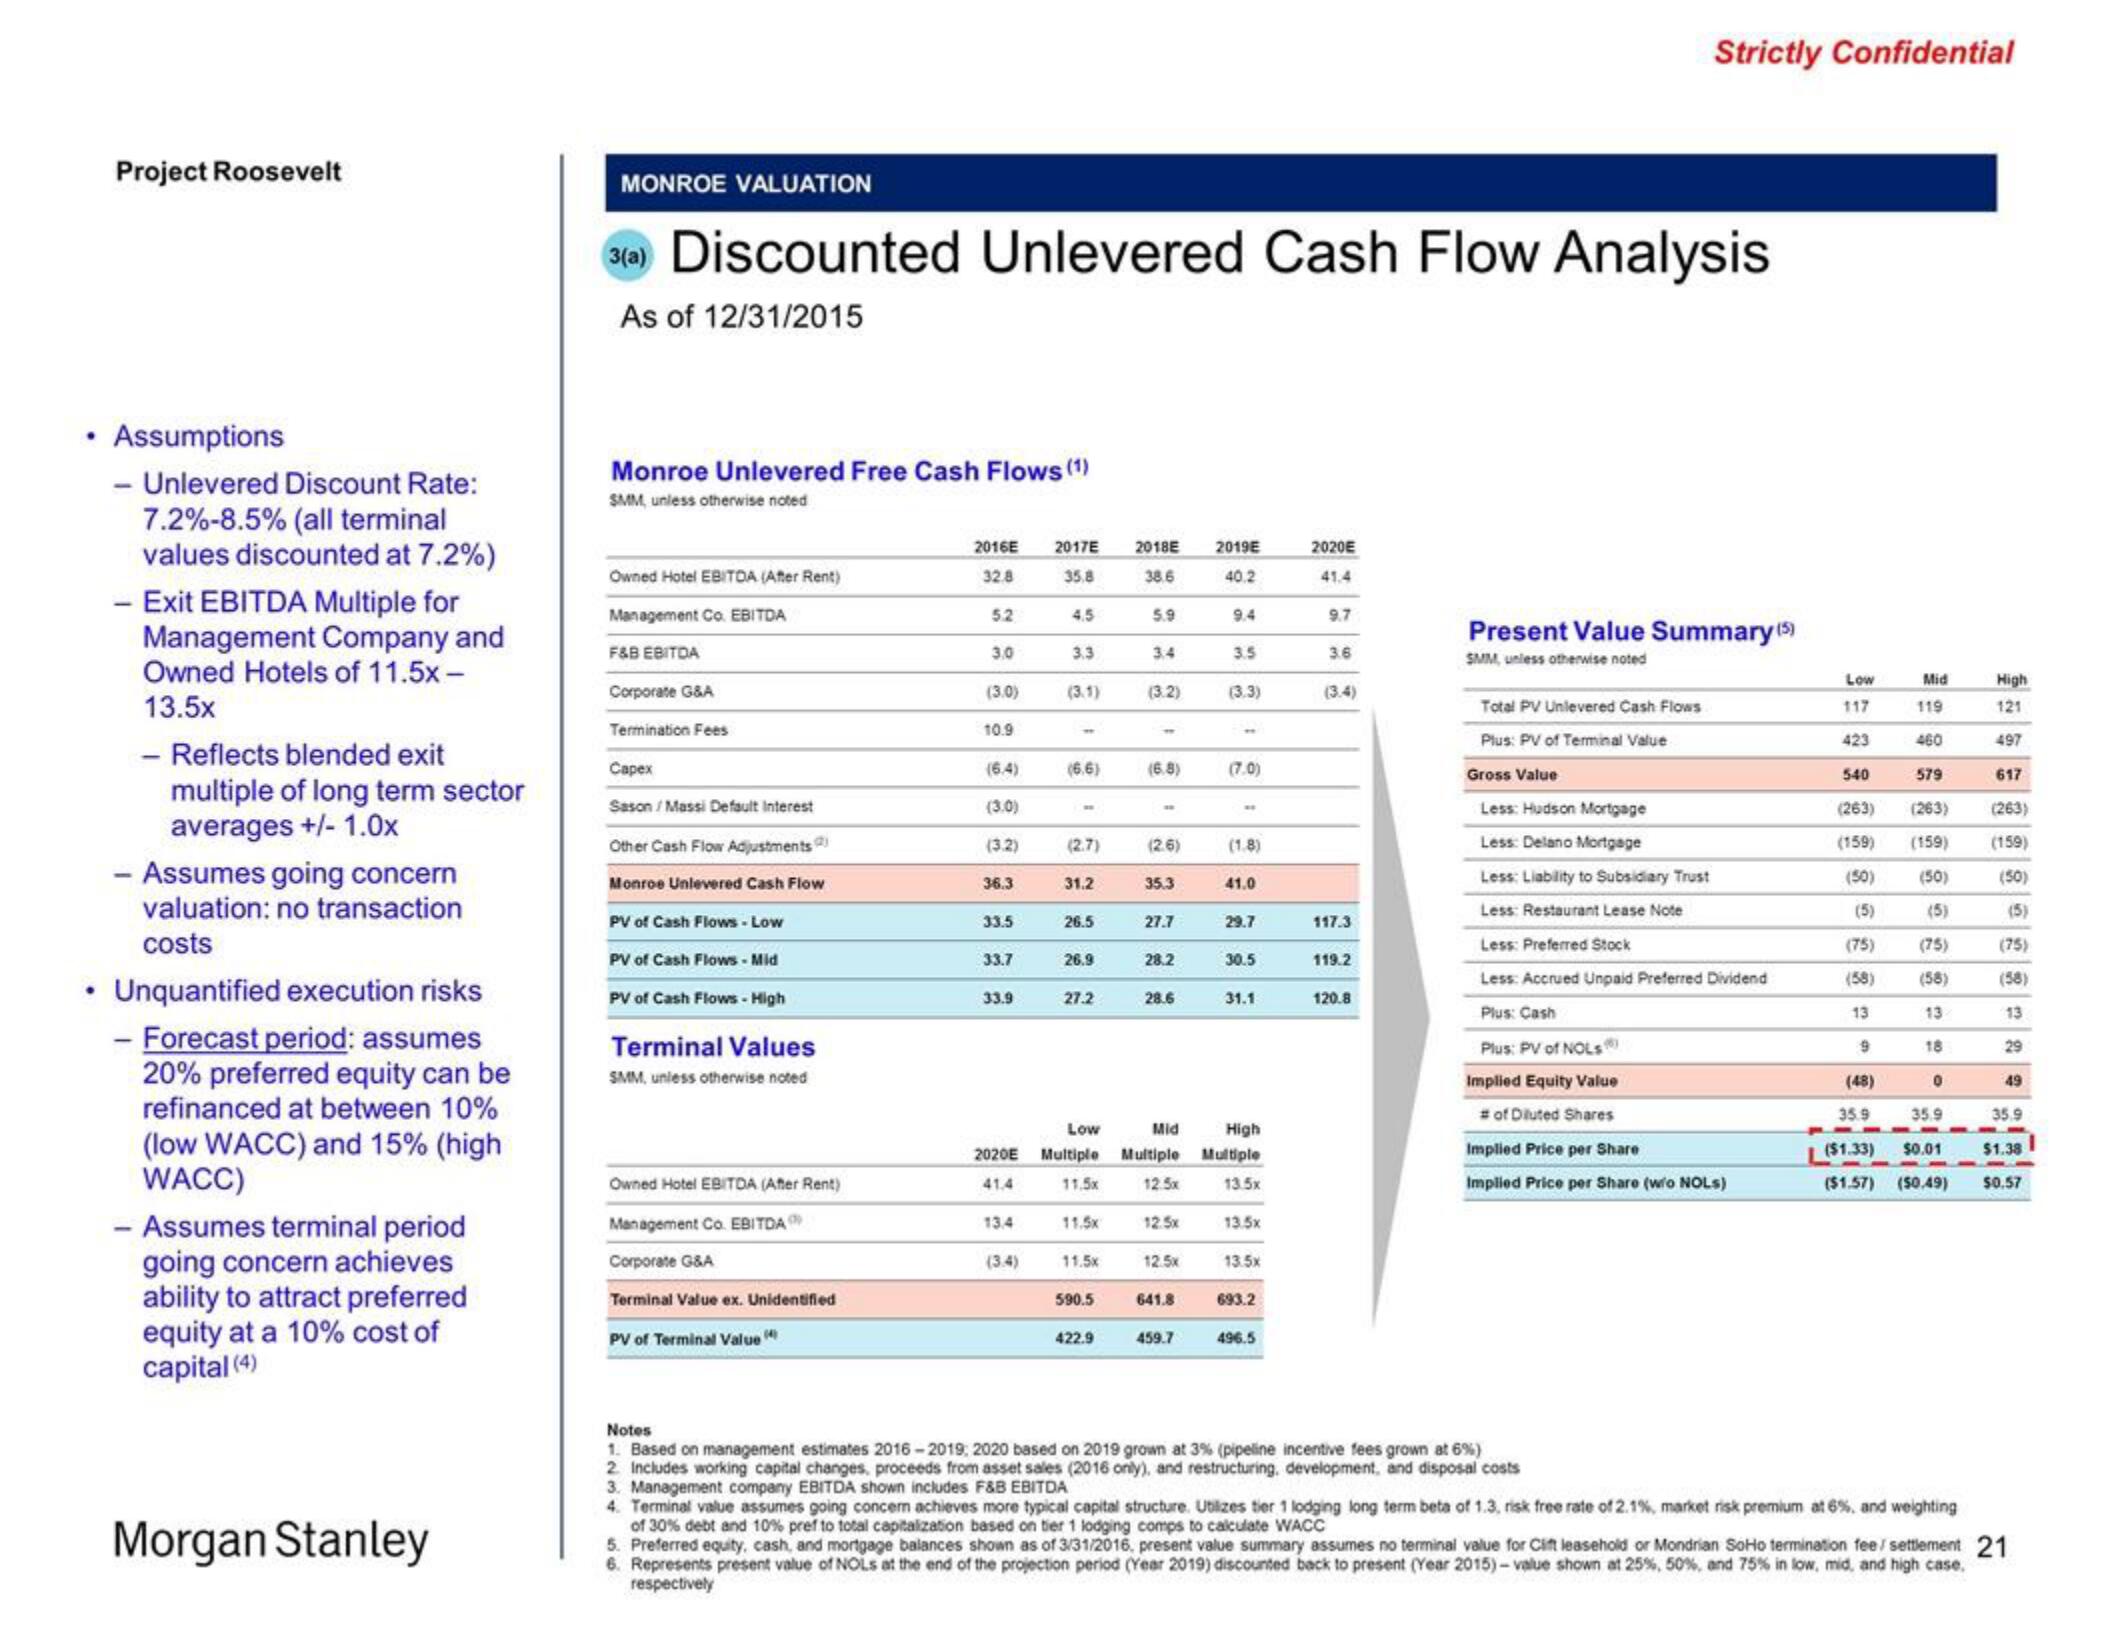
Assumptions
- Unlevered Discount Rate:
7.2%-8.5% (all terminal
values discounted at 7.2%)
- Exit EBITDA Multiple for
Management Company and
Owned Hotels of 11.5x -
13.5x
- Reflects blended exit
multiple of long term sector
averages +/- 1.0x
- Assumes going concern
valuation: no transaction
costs
Unquantified execution risks
- Forecast period: assumes
20% preferred equity can be
refinanced at between 10%
(low WACC) and 15% (high
WACC)
- Assumes terminal period
going concern achieves
ability to attract preferred
equity at a 10% cost of
capital (4)
Morgan Stanley
MONROE VALUATION
3(a) Discounted Unlevered Cash Flow Analysis
As of 12/31/2015
Monroe Unlevered Free Cash Flows (1)
SMM, unless otherwise noted
Owned Hotel EBITDA (After Rent)
Management Co., EBITDA
F&B EBITDA
Corporate G&A
Termination Fees
Capex
Sason/Massi Default Interest
Other Cash Flow Adjustments
Monroe Unlevered Cash Flow
PV of Cash Flows - Low
PV of Cash Flows - Mid
PV of Cash Flows - High
Terminal Values
SMM, unless otherwise noted
Owned Hotel EBITDA (After Rent)
Management Co. EBITDA
Corporate G&A
Terminal Value ex. Unidentified
PV of Terminal Value
2016E 2017E
32.8
35.8
5.2
3.0
(3.0)
10.9
(6.4)
(3.0)
(3.2)
36.3
33.5
33.7
33.9
2020E
41.4
13.4
(3.4)
4.5
3.3
(3.1)
(6.6)
(2.7)
31.2
26.5
26.9
27.2
Low
Multiple
11,58
115
1150
590.5
422.9
2018E
38.6
5.9
3.4
(3.2)
11
(6.8)
(2.6)
35.3
27.7
28.2
28.6
641.8
2019E
40.2
459.7
9.4
3.5
(3.3)
(7.0)
WE
(1.8)
41.0
29.7
30.5
Mid
High
Multiple Multiple
1250
135
125
1357
25
135
693.2
31.1
496.5
2020E
41.4
9.7
3.6
(3.4)
117.3
119.2
120.8
Present Value Summary (5)
SMM, unless otherwise noted
Total PV Unlevered Cash Flows
Plus: PV of Terminal Value
Gross Value
Strictly Confidential
Less: Hudson Mortgage
Less: Delano Mortgage
Less: Liability to Subsidiary Trust
Less: Restaurant Lease Note
Less: Preferred Stock
Less: Accrued Unpaid Preferred Dividend
Plus: Cash
Plus: PV of NOLS
Implied Equity Value
# of Diluted Shares
Implied Price per Share
Implied Price per Share (w/o NOLs)
Notes
1. Based on management estimates 2016-2019, 2020 based on 2019 grown at 3% (pipeline incentive fees grown at 6%)
2. Includes working capital changes, proceeds from asset sales (2016 only), and restructuring, development, and disposal costs
3. Management company EBITDA shown includes F&B EBITDA
Low
117
119
423
460
540
579
(263) (263)
(159) (159)
(50)
(50)
(5)
(5)
(75)
(75)
(58)
(58)
13
18
13
9
(48)
Mid
35.9
0
($1.33)
35.9
$0.01
($1.57) (50.49)
High
121
497
617
(263)
(159)
(50)
(5)
(75)
(58)
13
29
49
4. Terminal value assumes going concern achieves more typical capital structure. Utilizes tier 1 lodging long term beta of 1.3, risk free rate of 2.1%, market risk premium at 6%, and weighting
of 30% debt and 10% pref to total capitalization based on tier 1 lodging comps to calculate WACC
5. Preferred equity, cash, and mortgage balances shown as of 3/31/2016, present value summary assumes no terminal value for Clift leasehold or Mondrian SoHo termination fee / settlement 21
6. Represents present value of NOLS at the end of the projection period (Year 2019) discounted back to present (Year 2015)-value shown at 25%, 50%, and 75% in low, mid, and high case,
respectively
35.9
$1.38
$0.57View entire presentation