Sisecam Resources Investor Presentation Deck
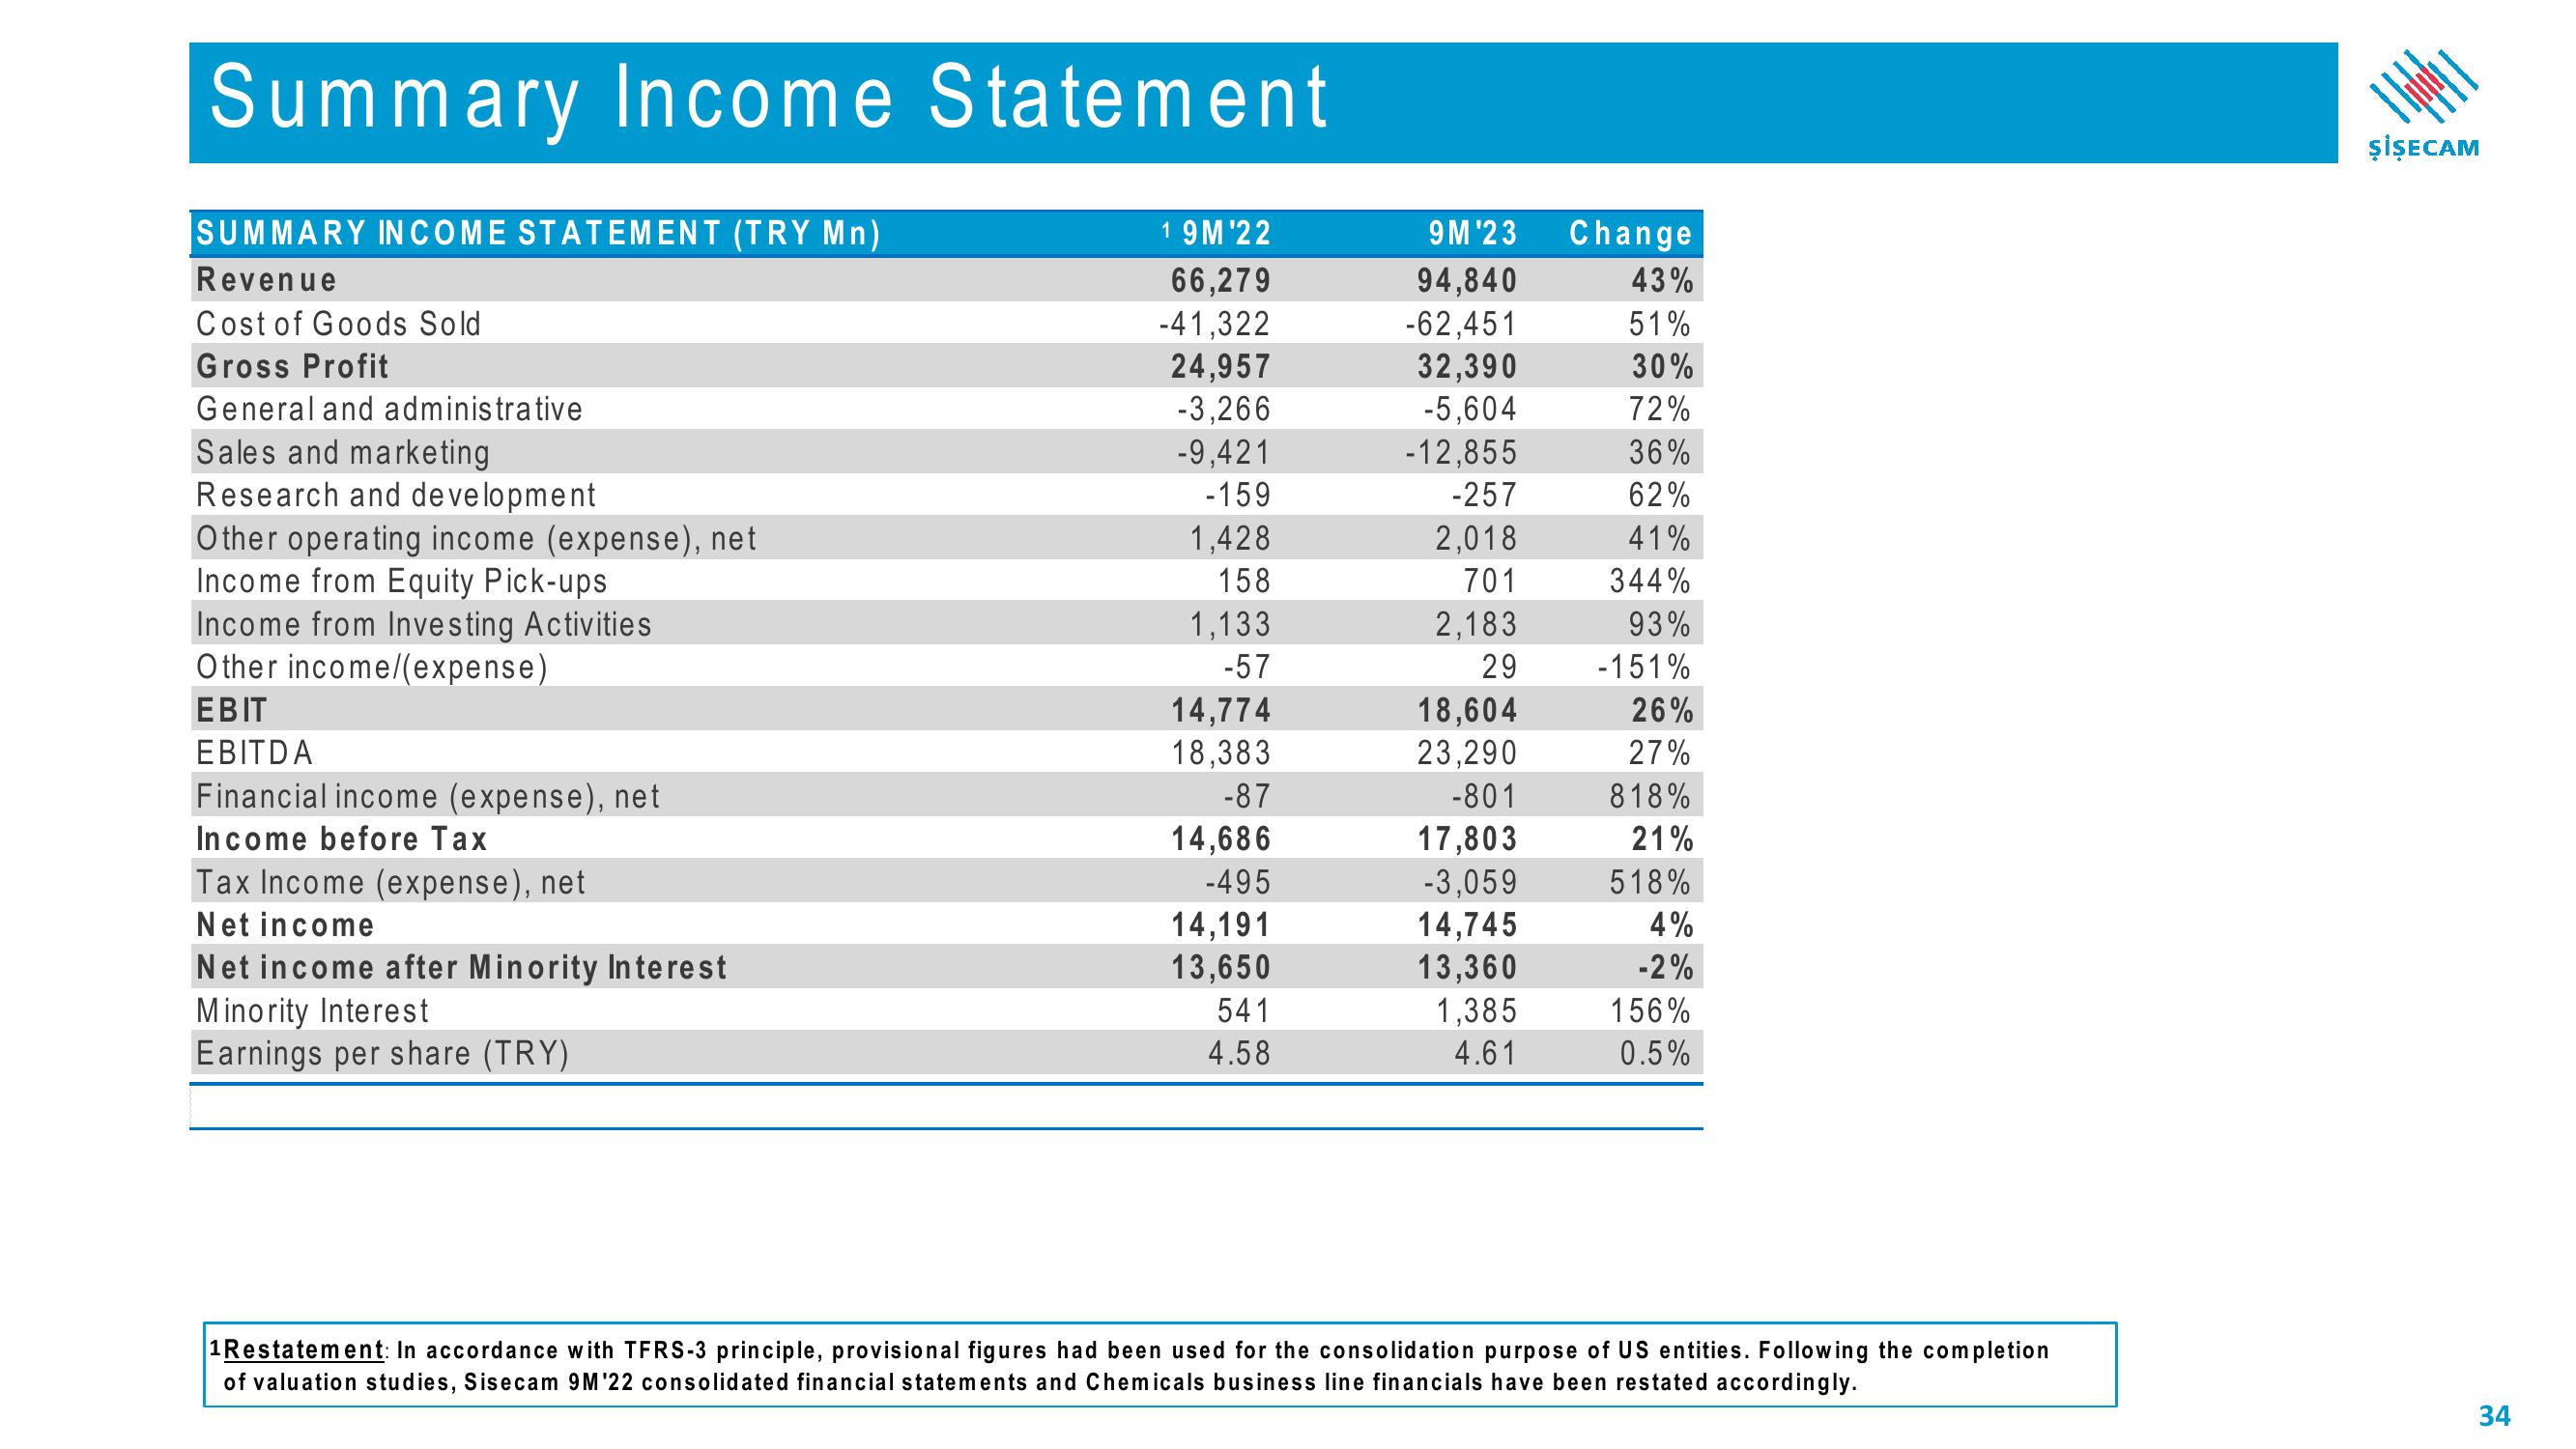
Summary Income Statement
SUMMARY INCOME STATEMENT (TRY Mn)
Revenue
Cost of Goods Sold
Gross Profit
General and administrative
Sales and marketing
Research and development
Other operating income (expense), net
Income from Equity Pick-ups
Income from Investing Activities
Other income/(expense)
EBIT
EBITDA
Financial income (expense), net
Income before Tax
Tax Income (expense), net
Net income
Net income after Minority Interest
Minority Interest
Earnings per share (TRY)
1 9M¹22
66,279
-41,322
24,957
-3,266
-9,421
-159
1,428
158
1,133
-57
14,774
18,383
-87
14,686
-495
14,191
13,650
541
4.58
9M¹23
94,840
-62,451
32,390
-5,604
-12,855
-257
2,018
701
2,183
29
18,604
23,290
-801
17,803
-3,059
14,745
13,360
1,385
4.61
Change
43%
51%
30%
72%
36%
62%
41%
344%
93%
-151%
26%
27%
818%
21%
518%
4%
-2%
156%
0.5%
1Restatement: In accordance with TFRS-3 principle, provisional figures had been used for the consolidation purpose of US entities. Following the completion
of valuation studies, Sisecam 9M¹22 consolidated financial statements and Chemicals business line financials have been restated accordingly.
|||||
ŞİŞECAM
34View entire presentation