J.P.Morgan Investment Banking Pitch Book
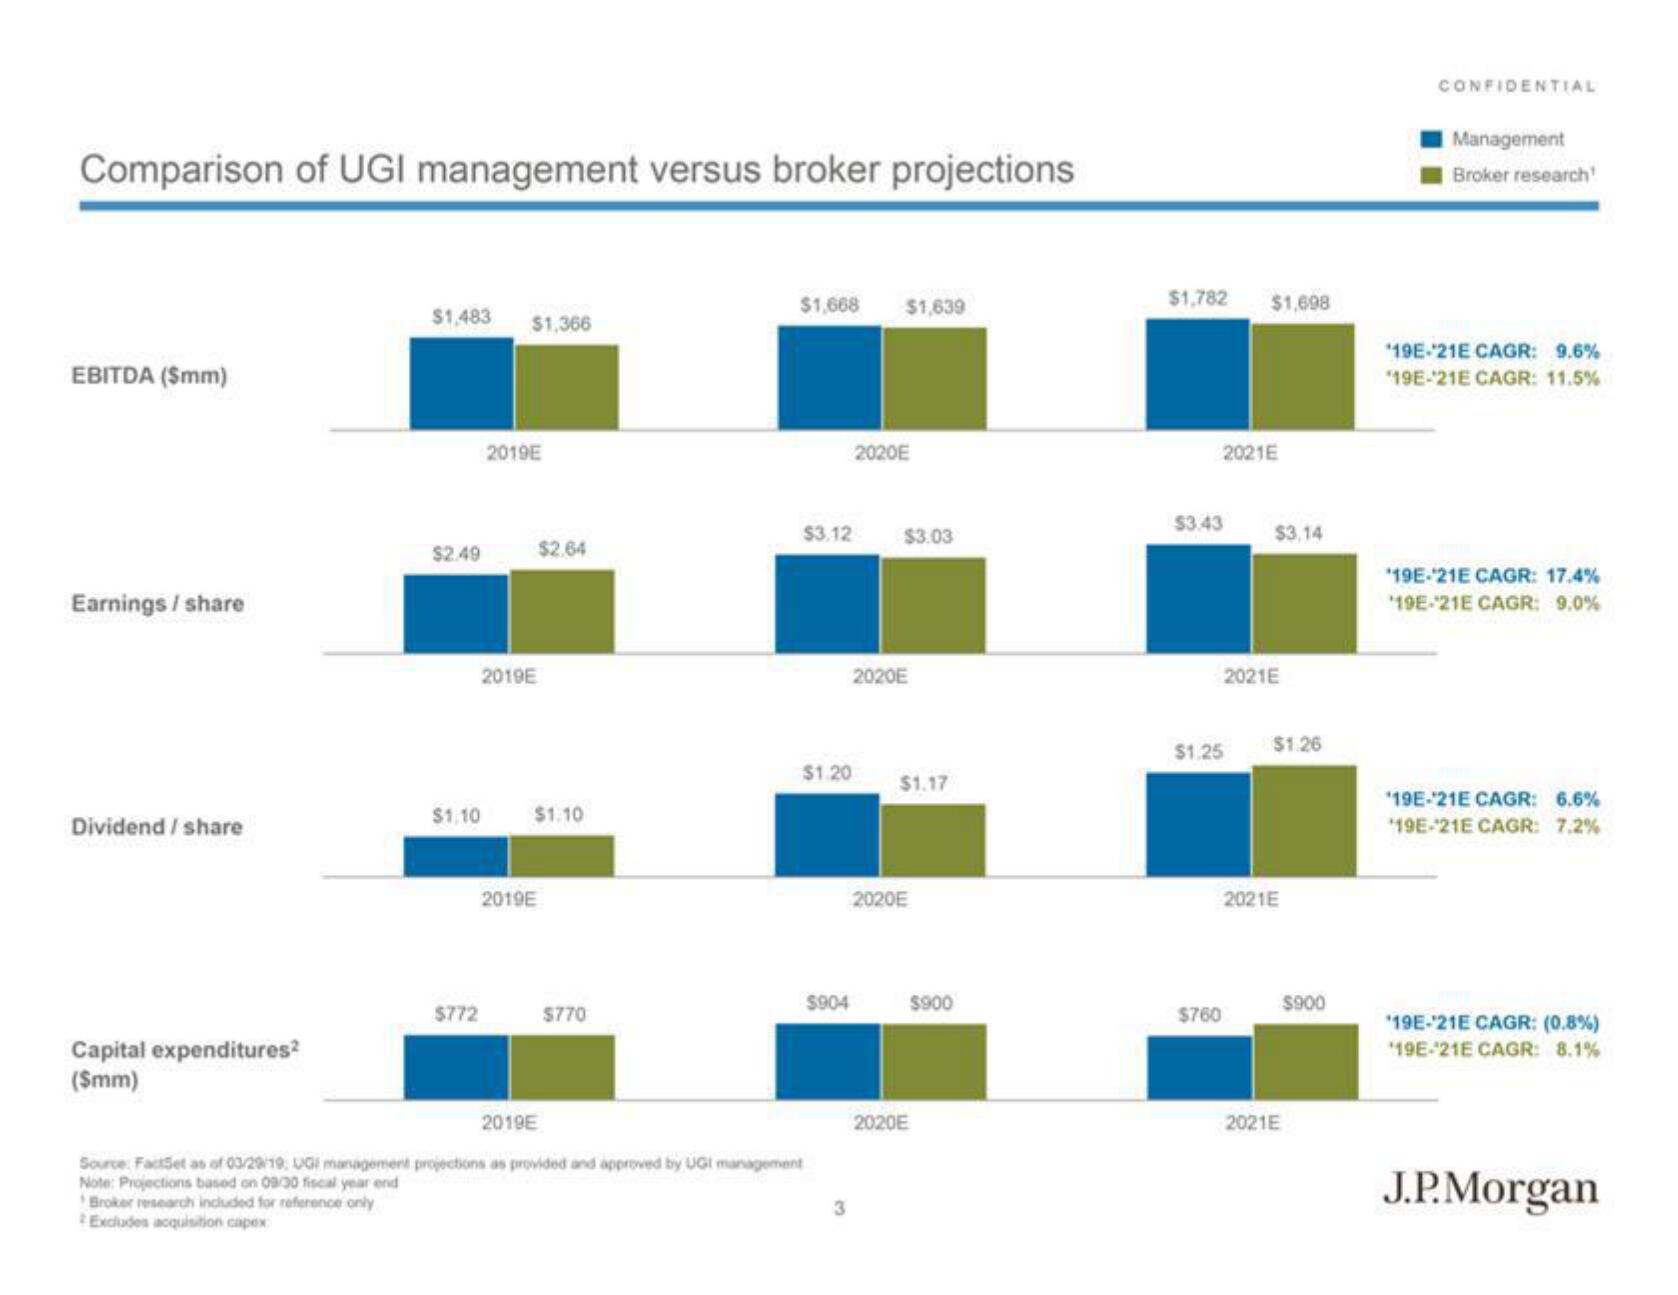
Comparison of UGI management versus broker projections
EBITDA ($mm)
Earnings / share
Dividend/share
Capital expenditures²
(Smm)
$1,483
$2.49
$1,10
$772
$1,366
2019E
2019E
$2.64
$1.10
2019E
$770
$1,668
$3.12
$1.20
2019E
Source: FactSet as of 03/29/19, UGE management projections as provided and approved by UGI management
Note: Projections based on 09/30 fiscal year end
Broker research included for reference only
Excludes acquisition capex
$904
3
$1,639
2020E
$3.03
2020E
$1.17
2020E
2020E
$900
$1,782
$3.43
2021E
$760
$1,698
$1.25
$3,14
2021E
$1.26
2021E
$900
2021E
CONFIDENTIAL
Management
Broker research
19E-21E CAGR: 9.6%
19E-21E CAGR: 11.5%
19E-21E CAGR: 17.4%
19E-21E CAGR: 9.0%
19E-21E CAGR: 6.6%
19E-21E CAGR: 7.2%
'19E-'21E CAGR: (0.8%)
19E-21E CAGR: 8.1%
J.P. MorganView entire presentation