Opendoor Investor Presentation Deck
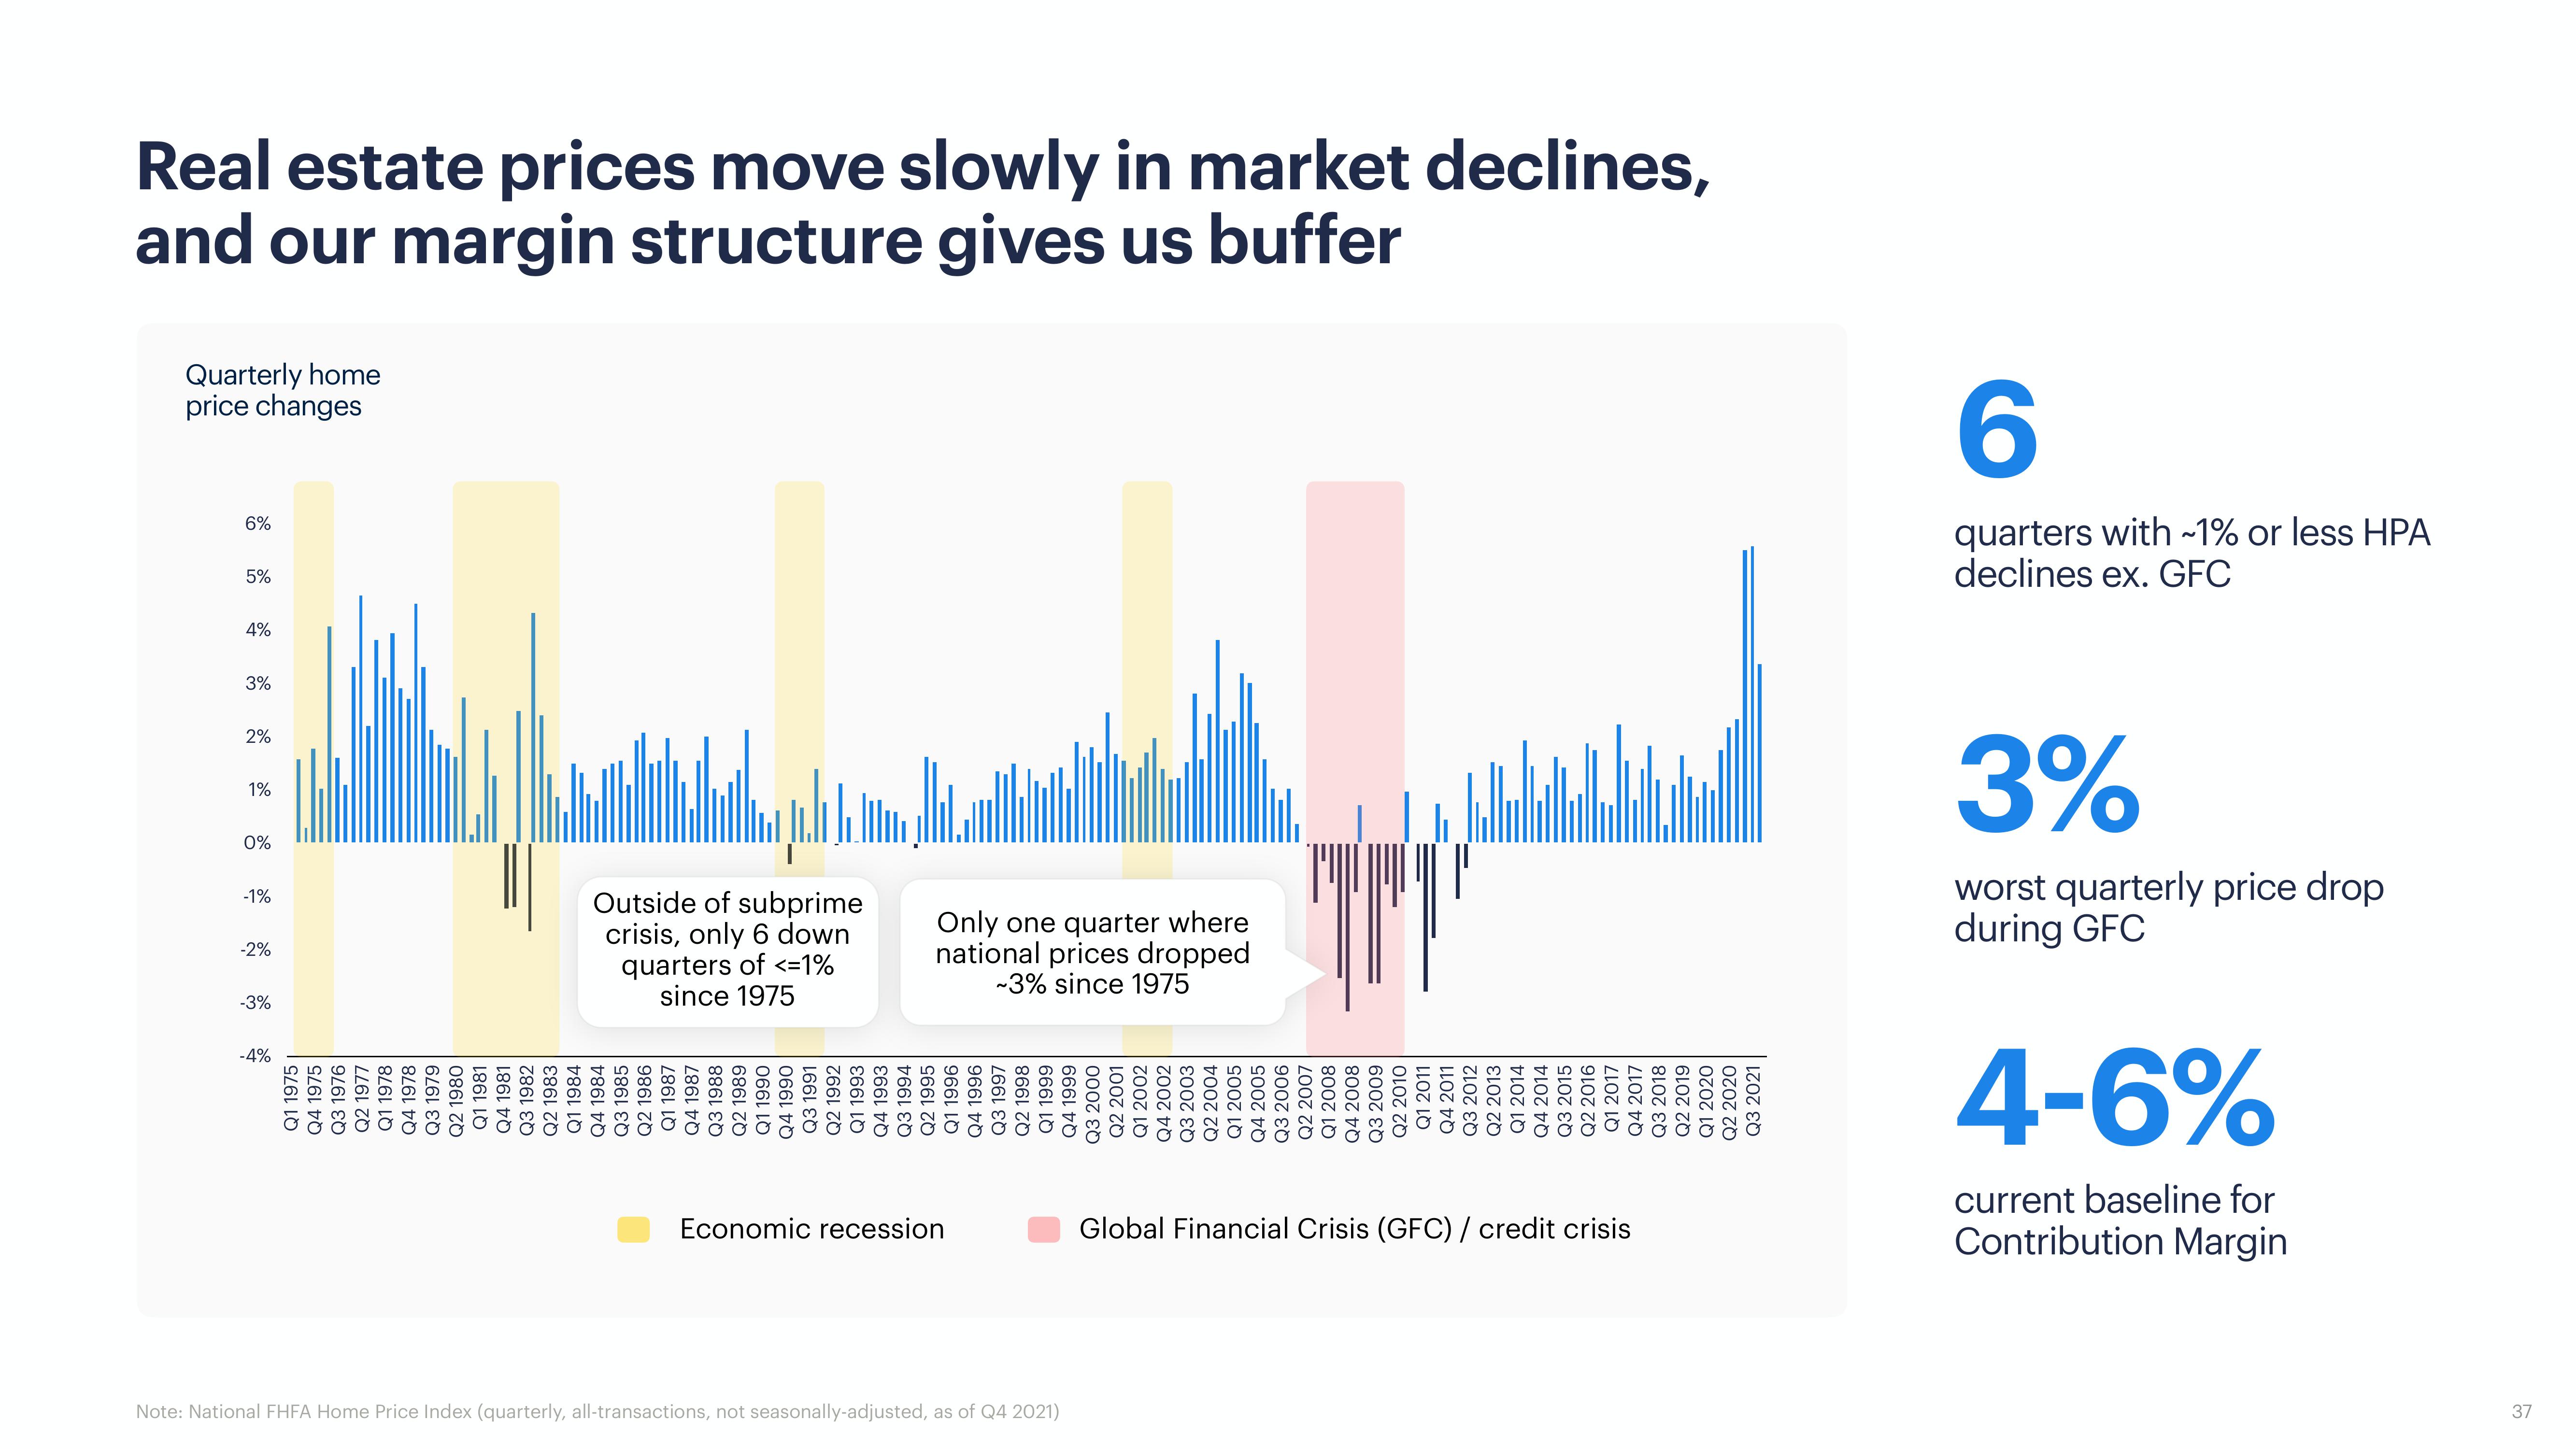
Note: National FHFA Home Price Index (quarterly, all-transactions, not seasonally-adjusted, as of Q4 2021)
37
Economic recession
Global Financial Crisis (GFC) / credit crisis
Q1 1975
Q4 1975
Q3 1976
Q2 1977
Q1 1978
Q4 1978
Q3 1979 |
Q2 1980
Q1 1981
Q4 1981
Q3 1982
Q2 1983
Q1 1984
Q4 1984 |
Q3 1985 |
Q2 1986 |
Q1 1987
Q4 1987
Q3 1988
Q2 1989
Q1 1990
Q4 1990 |
Q3 1991
Q2 1992
Q1 1993
Q4 1993
Q3 1994
Q2 1995
Q1 1996
Q4 1996
Q3 1997
Q2 1998
Q1 1999
Q4 1999
Q3 2000
Q2 2001
Q1 2002
Q4 2002
Q3 2003
Q2 2004
Q1 2005
Q4 2005
Q3 2006
Q2 2007
Q1 2008
Q4 2008
Q3 2009
Q2 2010
Q1 2011
Q4 2011
-4%
Q3 2012
Q2 2013 |
Q1 2014
Q4 2014
Q3 2015
Q2 2016
Q1 2017
Q4 2017
2018
Q3 2018
Q2 2019
Q1 2020
Q2 2020
Q3 2021
Contribution Margin
current baseline for
4-6%
-3%
-2%
-1%
since 1975
quarters of <=1%
crisis, only 6 down
Outside of subprime
-3% since 1975
national prices dropped
Only one quarter where
0%
1%
2%
3%
during GFC
worst quarterly price drop
3%
4%
5%
6%
price changes
Quarterly home
6
declines ex. GFC
quarters with ~1% or less HPA
and our margin structure gives us buffer
Real estate prices move slowly in market declines,View entire presentation