Cyxtera Investor Presentation Deck
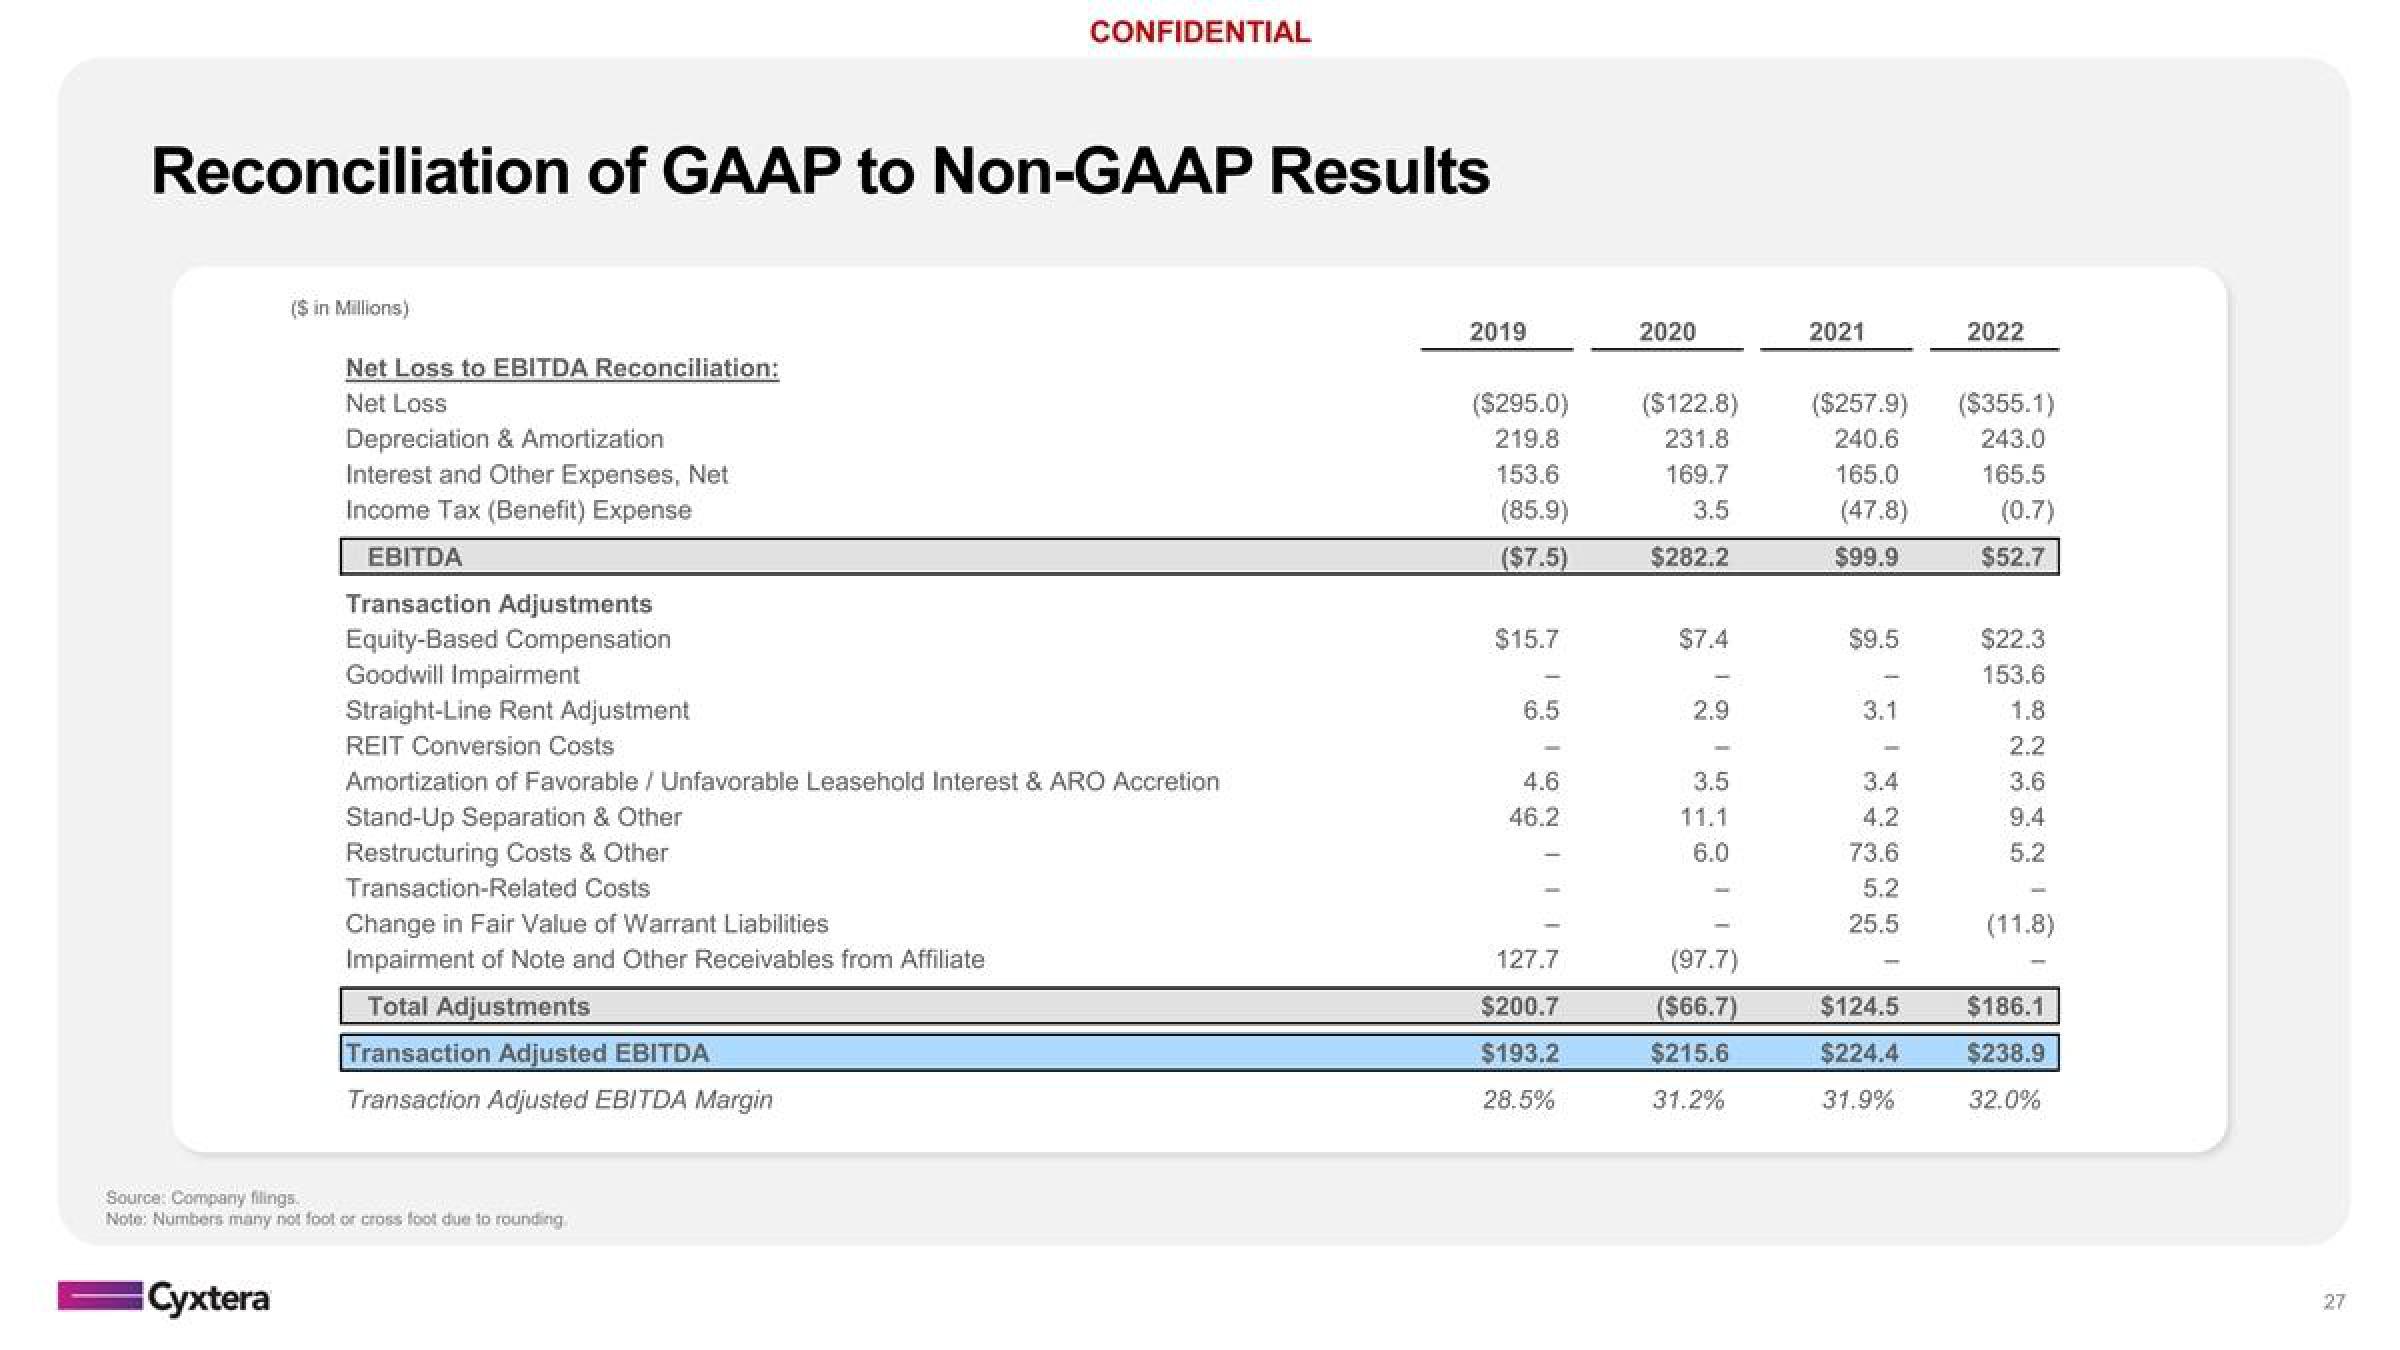
Reconciliation of GAAP to Non-GAAP Results
($ in Millions)
Cyxtera
Net Loss to EBITDA Reconciliation:
Net Loss
Depreciation & Amortization
Interest and Other Expenses, Net
Income Tax (Benefit) Expense
EBITDA
Transaction Adjustments
Equity-Based Compensation
Goodwill Impairment
Straight-Line Rent Adjustment
CONFIDENTIAL
REIT Conversion Costs
Amortization of Favorable / Unfavorable Leasehold Interest & ARO Accretion
Stand-Up Separation & Other
Restructuring Costs & Other
Transaction-Related Costs
Change in Fair Value of Warrant Liabilities
Impairment of Note and Other Receivables from Affiliate
Total Adjustments
Transaction Adjusted EBITDA
Transaction Adjusted EBITDA Margin
Source: Company filings.
Note: Numbers many not foot or cross foot due to rounding.
2019
($295.0)
219.8
153.6
(85.9)
($7.5)
$15.7
6.5
I
4.6
46.2
127.7
$200.7
$193.2
28.5%
2020
($122.8)
231.8
169.7
3.5
$282.2
$7.4
2.9
3.5
11.1
6.0
(97.7)
($66.7)
$215.6
31.2%
2021
($257.9)
240.6
165.0
(47.8)
$99.9
$9.5
I
3.1
3.4
4.2
73.6
5.2
25.5
-
$124.5
$224.4
31.9%
2022
($355.1)
243.0
165.5
(0.7)
$52.7
$22.3
153.6
1.8
2.2
3.6
9.4
5.2
(11.8)
$186.1
$238.9
32.0%View entire presentation