GlobalFoundries Results Presentation Deck
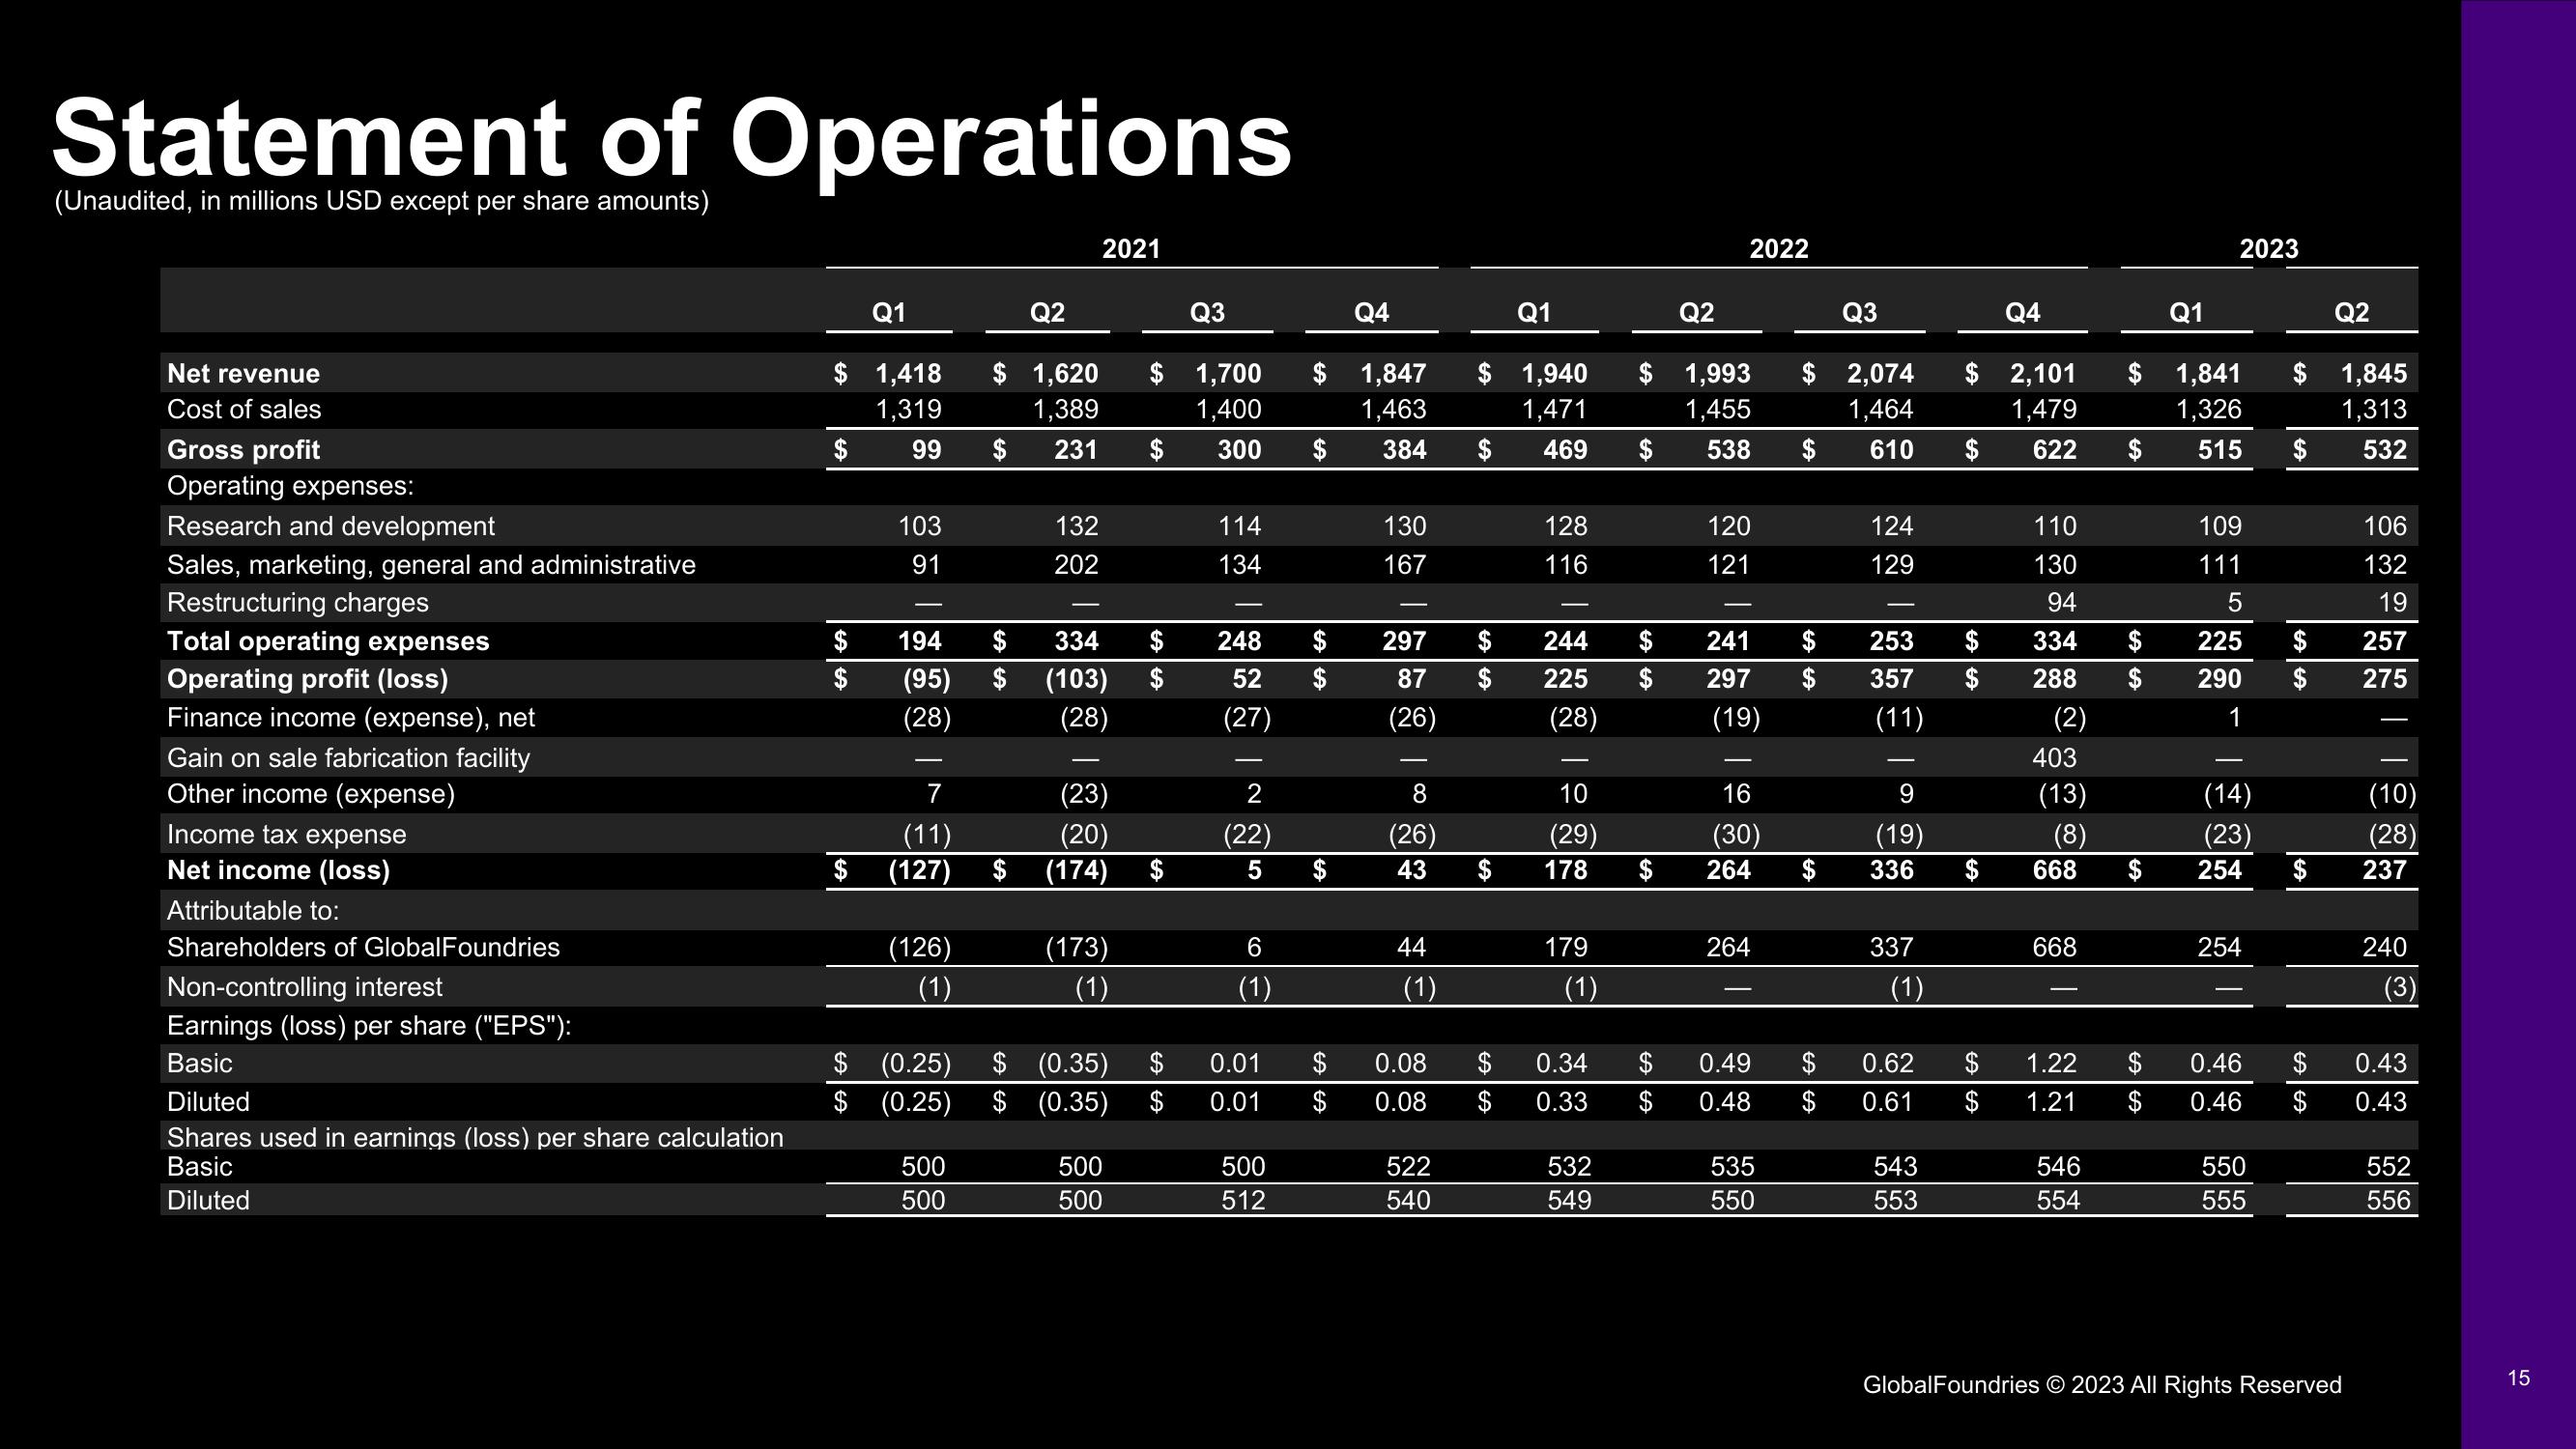
Statement of Operations
(Unaudited, in millions USD except per share amounts)
Net revenue
Cost of sales
Gross profit
Operating expenses:
Research and development
Sales, marketing, general and administrative
Restructuring charges
Total operating expenses
Operating profit (loss)
Finance income (expense), net
Gain on sale fabrication facility
Other income (expense)
Income tax expense
Net income (loss)
Attributable to:
Shareholders of GlobalFoundries
Non-controlling interest
Earnings (loss) per share ("EPS"):
Basic
Diluted
Shares used in earnings (loss) per share calculation
Basic
Diluted
$
Q1
$ 1,418 $ 1,620
1,319
1,389
99
GAGA
103
91
Q2
(126)
(1)
2021
132
202
194
$ 334
(95) $ (103)
(28)
(28)
500
500
$ 231 $
(23)
(20)
(11)
$ (127) $ (174)
(173)
(1)
(0.25) $ (0.35)
$ (0.25) $ (0.35)
500
500
$ 1,700
1,400
300 $
$
$
LA
$
$
GA
Q3
114
134
248
$
52 $
(27)
2
(22)
5
LO
6
(1)
0.01
0.01
500
512
$ 1,847 $ 1,940
1,463
1,471
384
469
A LA
$
SALA
Q4
$
130
167
-
297 $
87 $
(26)
8
(26)
43
44
(1)
$ 0.08
0.08
$
522
540
$
$
GAGA
Q1
$
128
116
244 $
225
(28)
10
(29)
178
179
(1)
0.34
0.33
532
549
Q2
$ 1,993
1,455
538
$
2022
120
121
241
$ 297
(19)
-
16
(30)
264
264
0.49
0.48
535
550
$ 2,074
1,464
$ 610
$
$ 253
$
357
(11)
$
Q3
GA
$
124
129
9
(19)
336
337
(1)
0.62
0.61
543
553
Q4
$ 2,101
1,479
$ 622 $
$
$
$
SAA
$
110
130
94
334
288
(2)
403
(13)
(8)
668
668
1.22
1.21
546
554
$
SALA
$
$
$
Q1
2023
1,841
1,326
515
109
111
5
225
290
1
(14)
(23)
254
254
0.46
0.46
550
555
$
$
Q2
1,845
1,313
532
106
132
19
257
275
(10)
(28)
$ 237
240
$ 0.43
非非
GlobalFoundries © 2023 All Rights Reserved
$ 0.43
552
556
15View entire presentation