Hanmi Financial Results Presentation Deck
Deposit Base
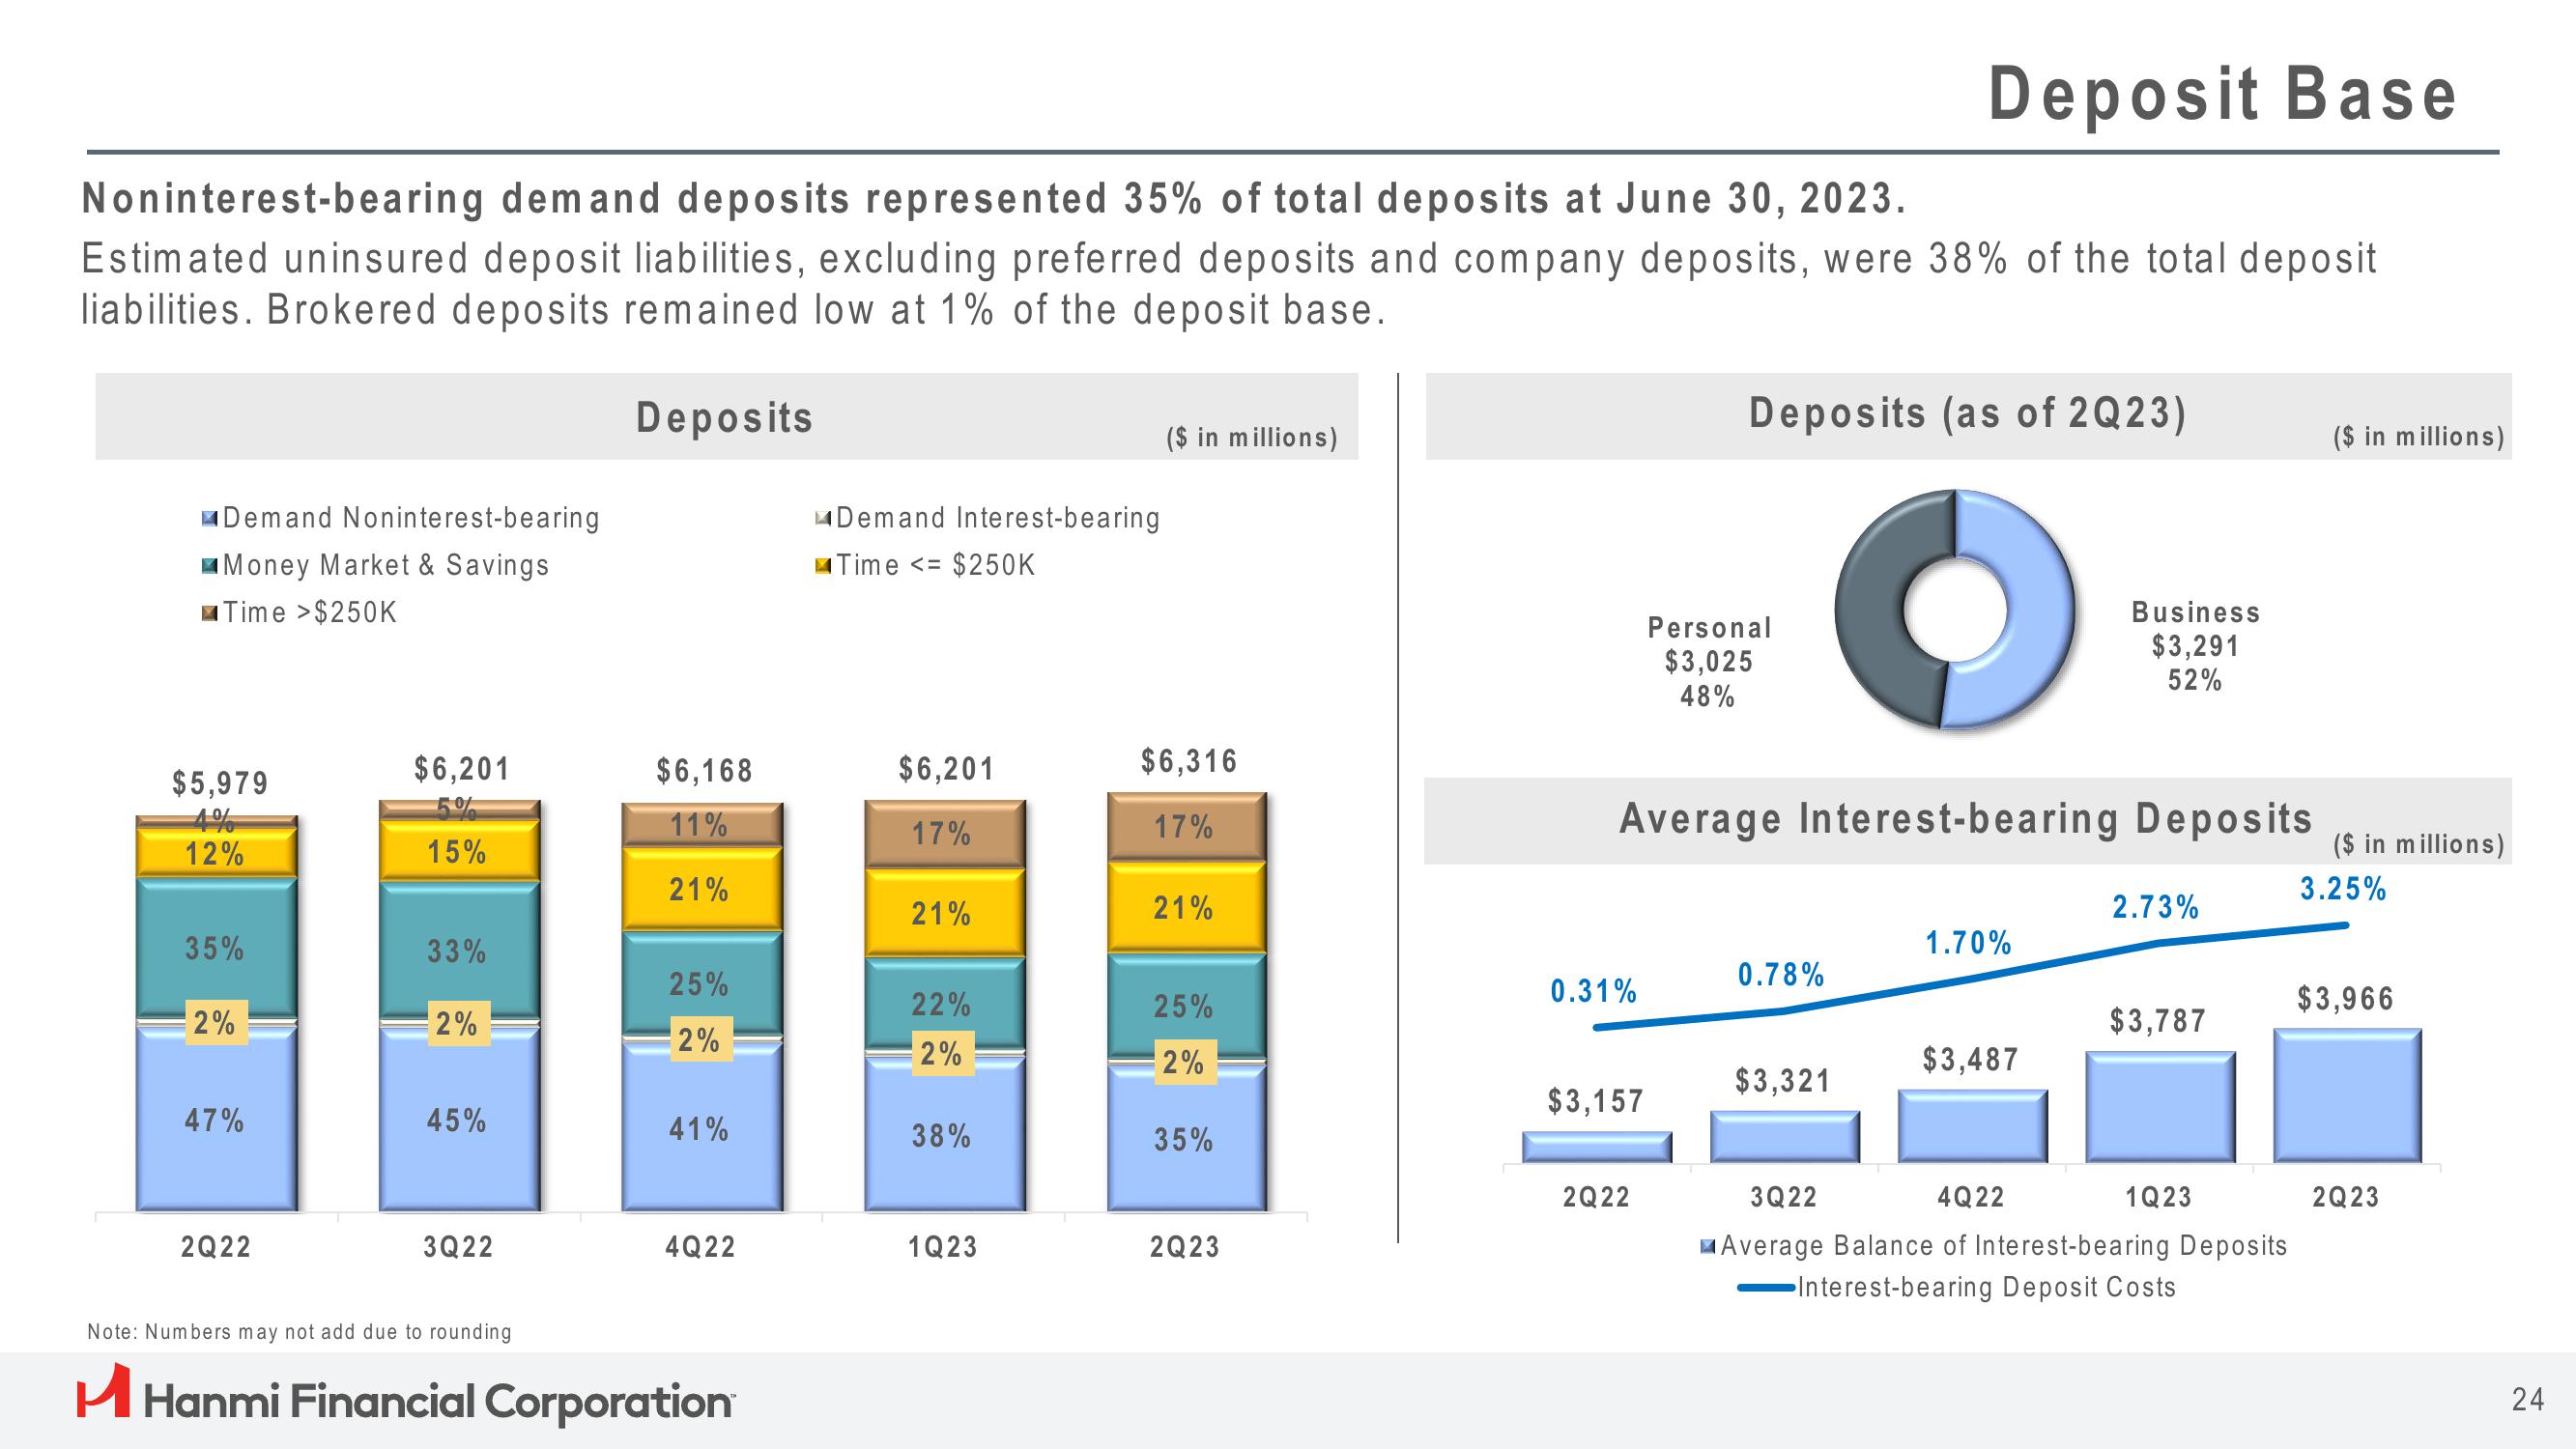
Noninterest-bearing demand deposits represented 35% of total deposits at June 30, 2023.
Estimated uninsured deposit liabilities, excluding preferred deposits and company deposits, were 38% of the total deposit
liabilities. Brokered deposits remained low at 1% of the deposit base.
Deposits
Demand Noninterest-bearing
Money Market & Savings
Time >$250K
$5,979
12%
35%
-2%
47%
2Q22
$6,201
15%
33%
2%
45%
3Q22
$6,168
11%
21%
25%
2%
41%
4Q22
Note: Numbers may not add due to rounding
H Hanmi Financial Corporation
Demand Interest-bearing
Time <= $250K
$6,201
17%
21%
22%
2%
38%
1Q23
($ in millions)
$6,316
17%
21%
25%
2%
35%
2Q23
Deposits (as of 2Q23)
O
Average Interest-bearing Deposits
0.31%
$3,157
2Q22
Personal
$3,025
48%
0.78%
$3,321
1.70%
$3,487
Business
$3,291
52%
2.73%
$3,787
4Q22
3Q22
Average Balance of Interest-bearing Deposits
Interest-bearing Deposit Costs
1Q23
($ in millions)
($ in millions)
3.25%
$3,966
2Q23
24View entire presentation