Main Street Capital Fixed Income Presentation Deck slide image

Main Street Capital Fixed Income Presentation Deck

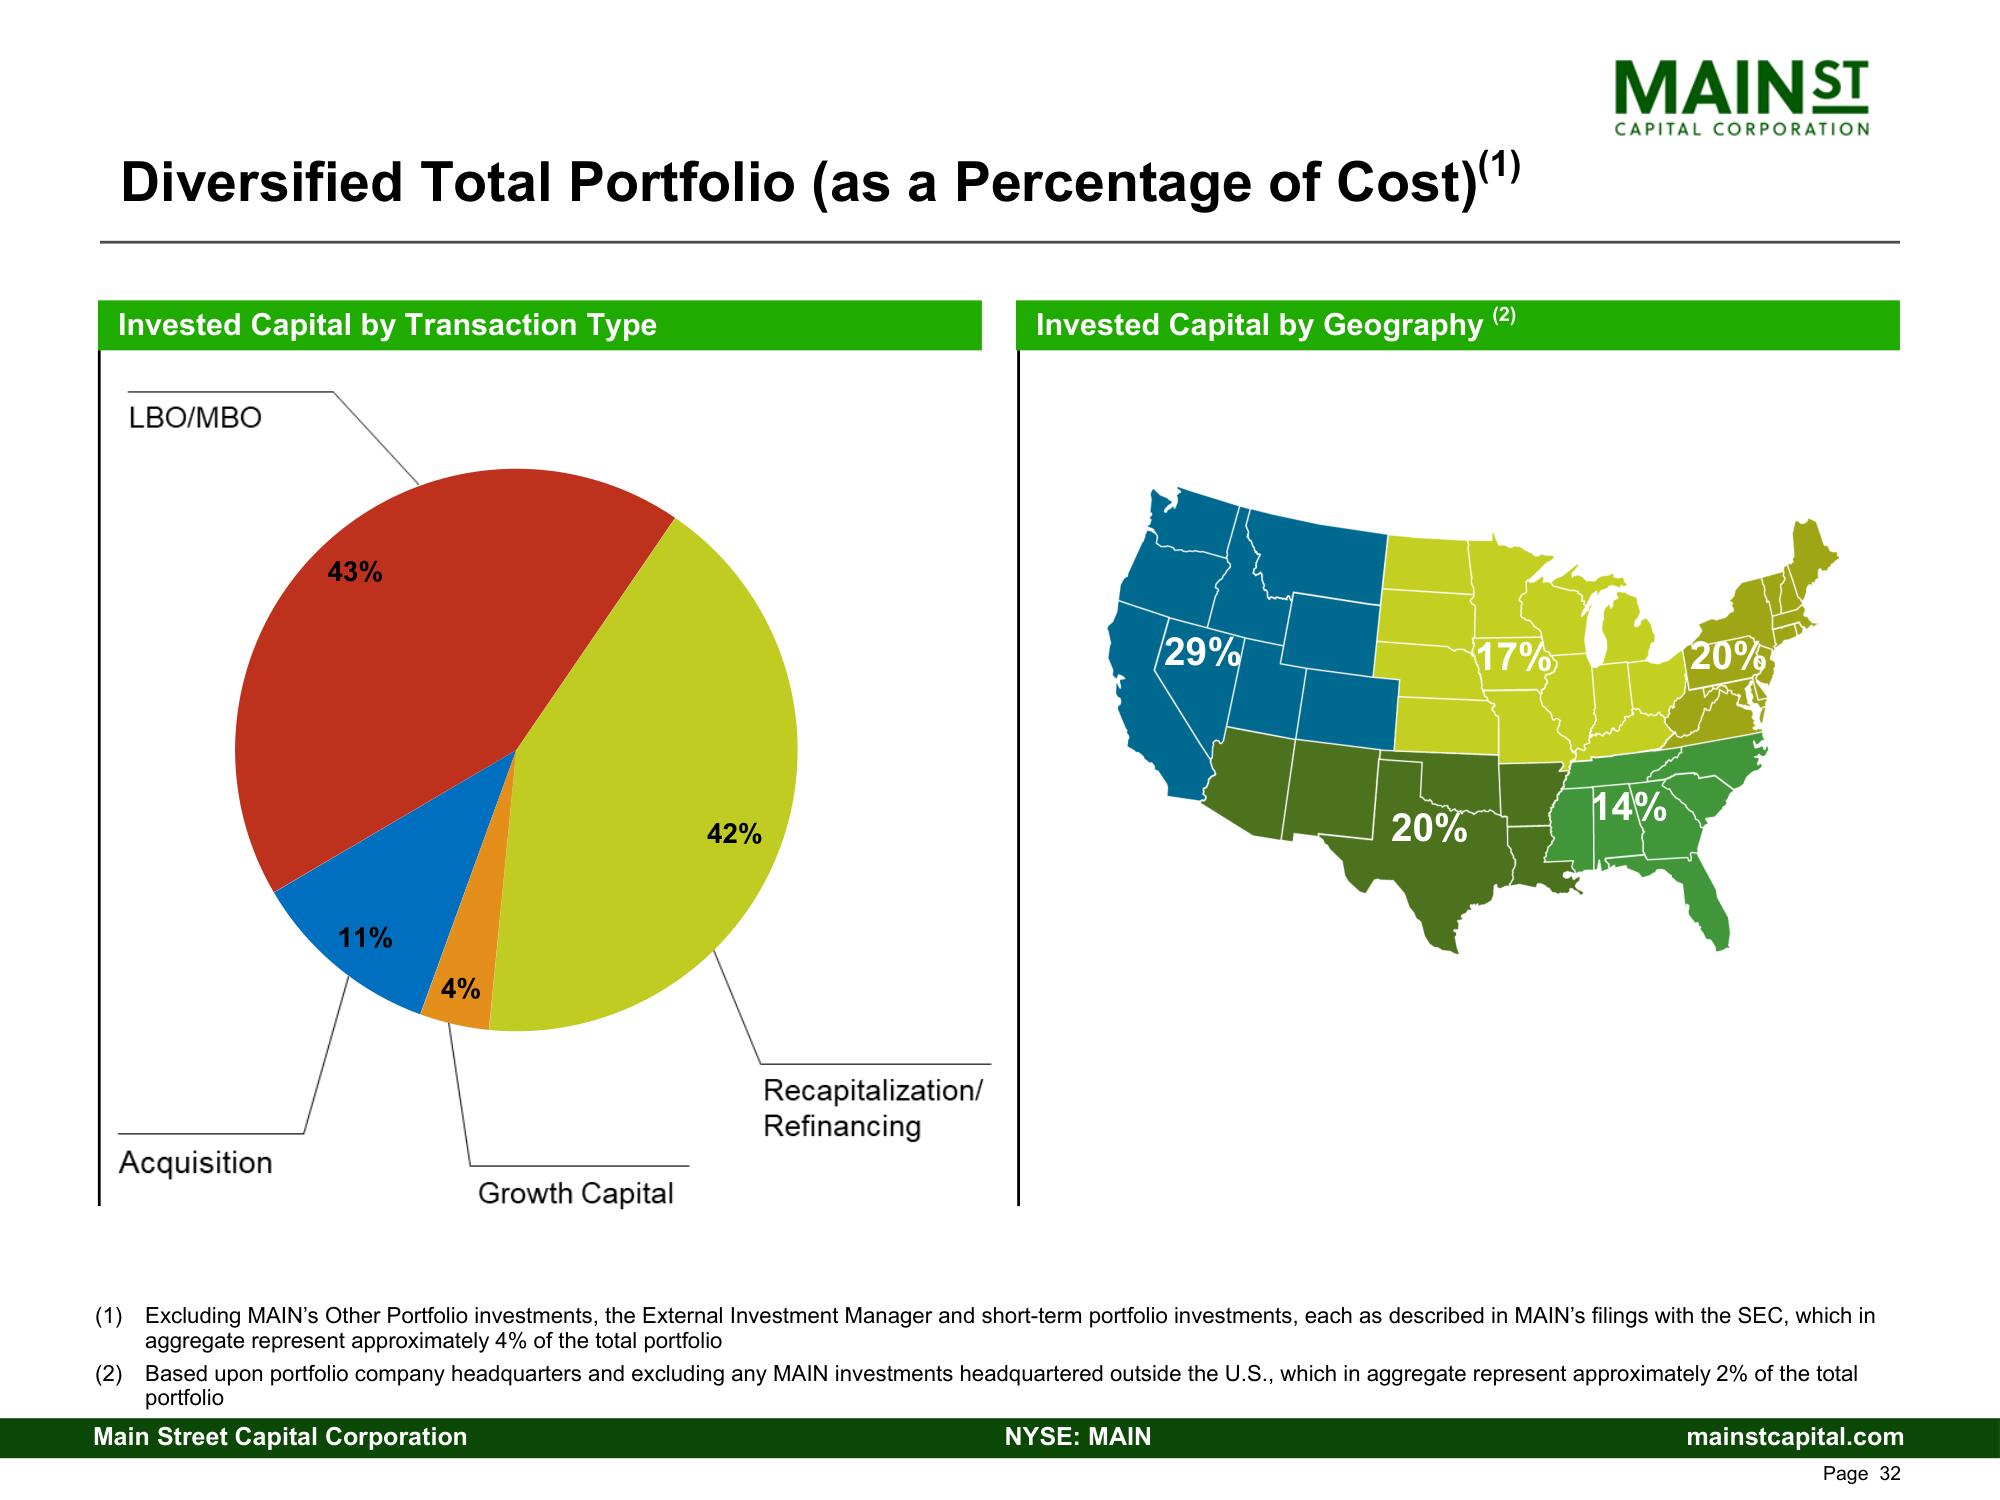
Diversified Total Portfolio (as a Percentage of Cost)(1) Invested Capital by Transaction Type LBO/MBO Acquisition 43% 11% 4% Growth Capital 42% Recapitalization/ Refinancing Invested Capital by Geography 29% 20% NYSE: MAIN (2) 17% MAINST CAPITAL CORPORATION 14% 20% (1) Excluding MAIN's Other Portfolio investments, the External Investment Manager and short-term portfolio investments, each as described in MAIN's filings with the SEC, which in aggregate represent approximately 4% of the total portfolio (2) Based upon portfolio company headquarters and excluding any MAIN investments headquartered outside the U.S., which in aggregate represent approximately 2% of the total portfolio Main Street Capital Corporation mainstcapital.com Page 32
View entire presentation