AngloAmerican Results Presentation Deck
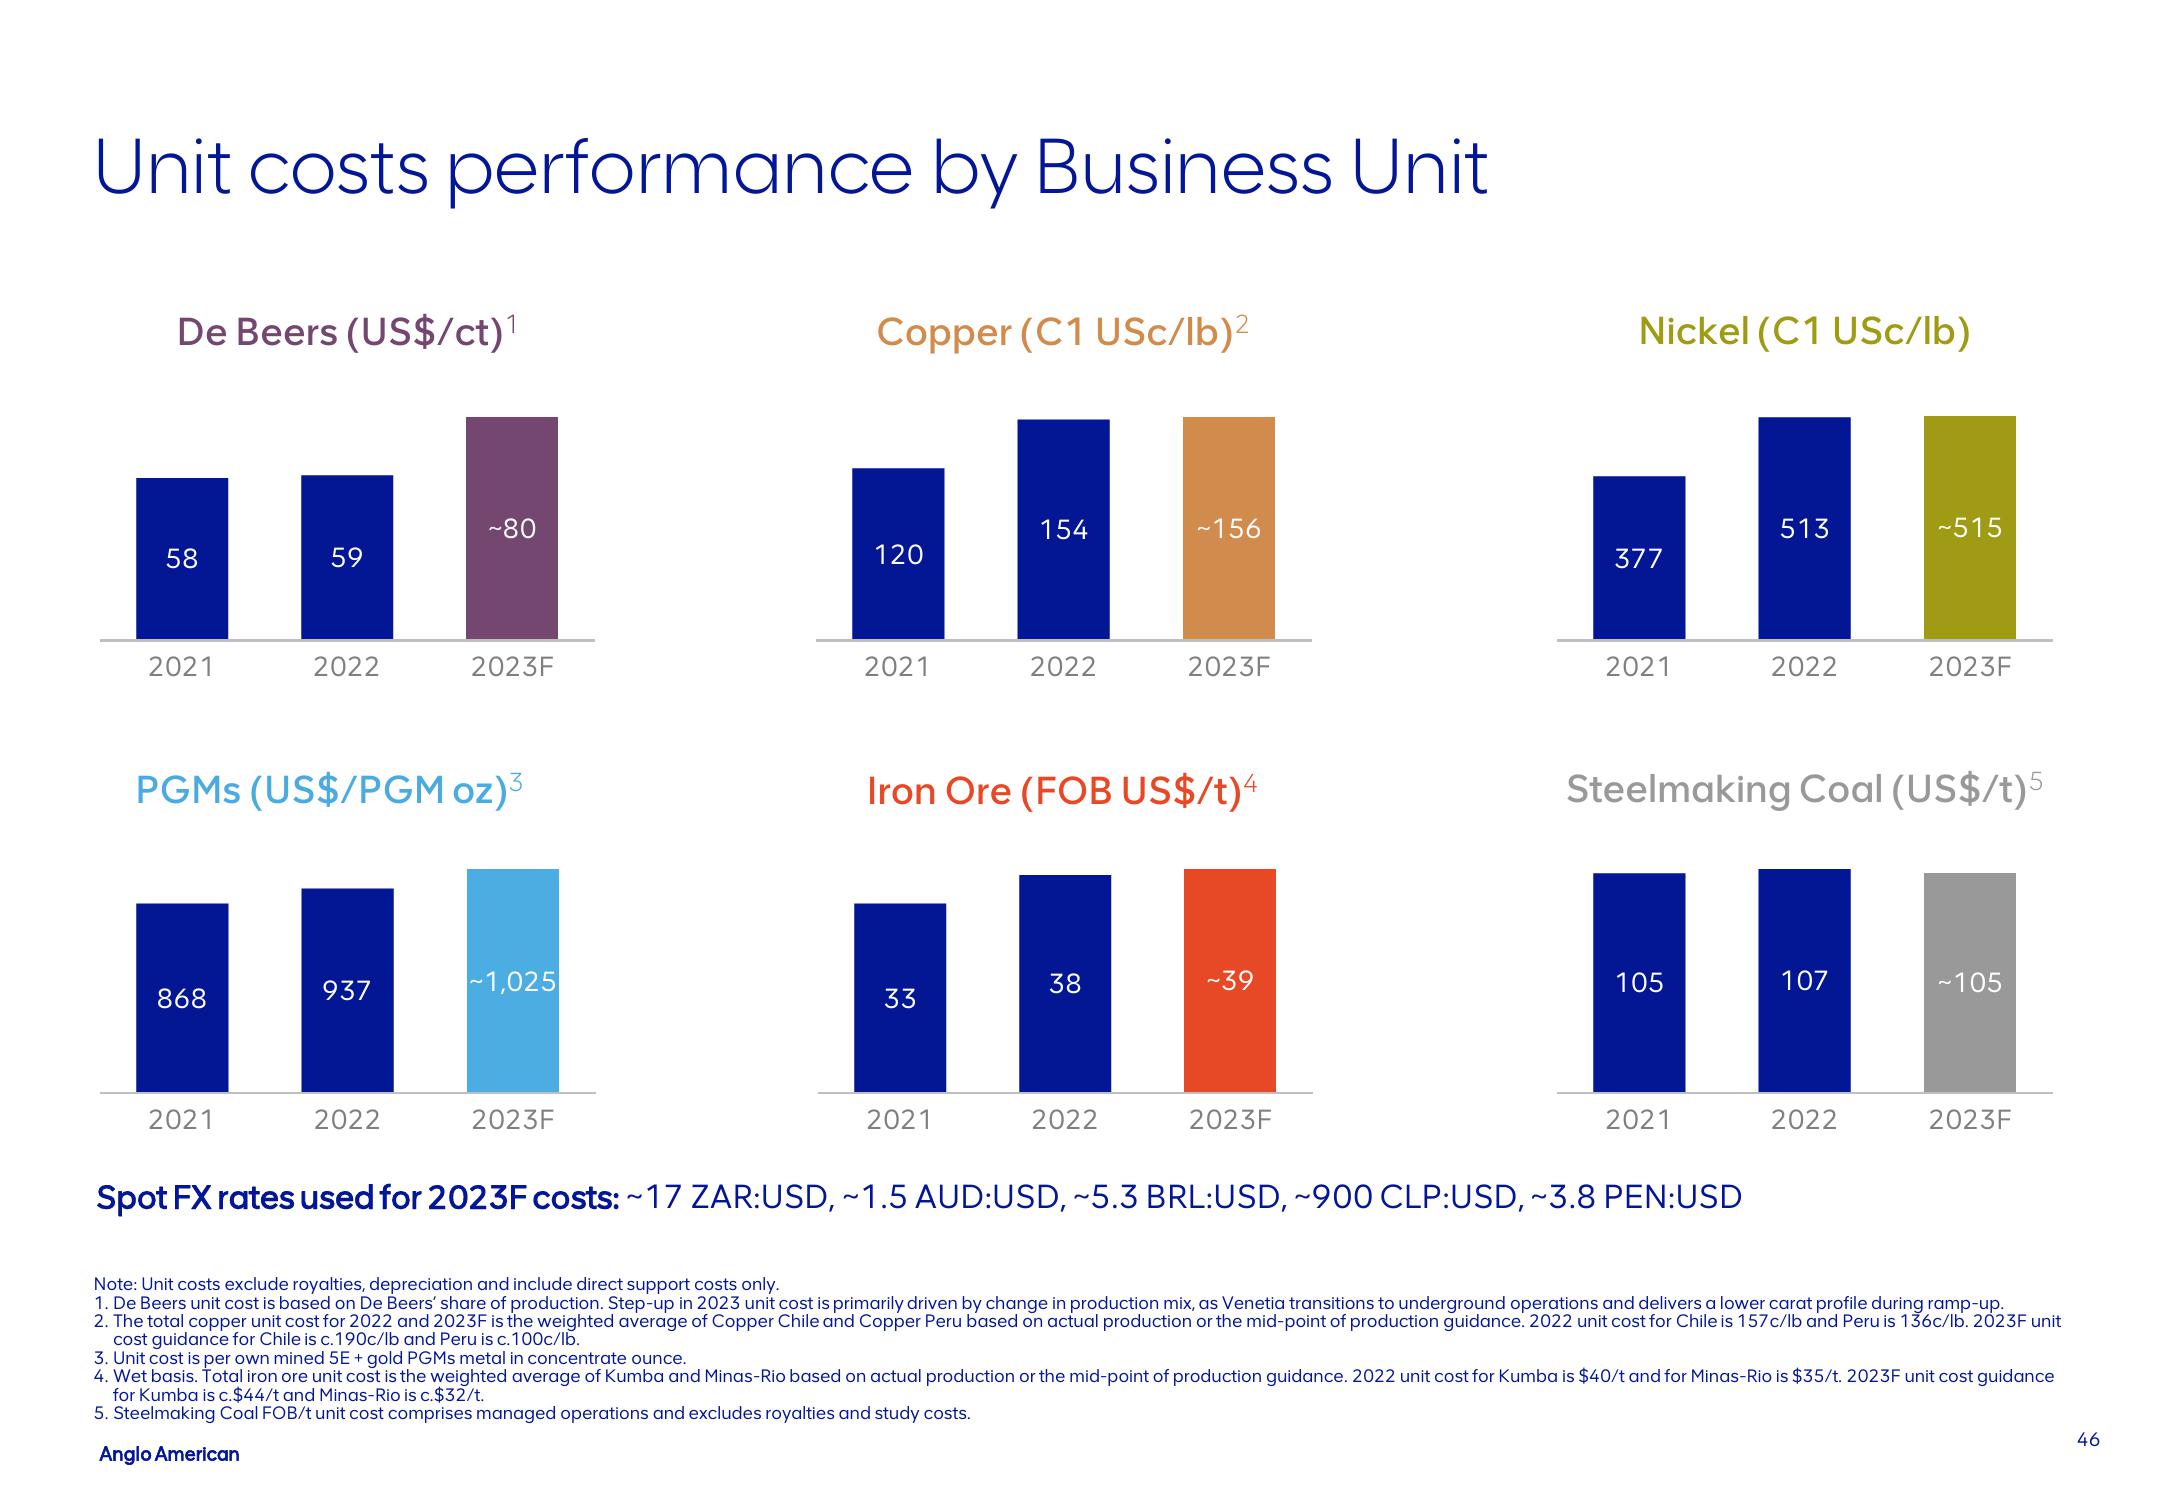
Unit costs performance by Business Unit
De Beers (US$/ct)¹
58
2021
868
59
2021
2022
PGMs (US$/PGM oz)³
937
~80
2022
2023F
~1,025
2023F
Copper (C1 USc/lb)²
120
2021
33
154
2021
2022
Iron Ore (FOB US$/t)4
38
~156
2022
2023F
~39
2023F
Nickel (C1 USc/lb)
377
2021
105
2021
513
Spot FX rates used for 2023F costs: ~17 ZAR:USD, ~1.5 AUD:USD, ~5.3 BRL:USD, ~900 CLP:USD, ~3.8 PEN:USD
2022
Steelmaking Coal (US$/t)5
107
~515
2022
2023F
~105
2023F
Note: Unit costs exclude royalties, depreciation and include direct pport costs only.
1. De Beers unit cost is based on De Beers' share of production. Step-up in 2023 unit cost is primarily driven by change in production mix, as Venetia transitions to underground operations and delivers a lower carat profile during ramp-up.
2. The total copper unit cost for 2022 and 2023F is the weighted average of Copper Chile and Copper Peru based on actual production or the mid-point of production guidance. 2022 unit cost for Chile is 157 c/lb and Peru is 136c/lb. 2023F unit
cost guidance for Chile is c.190c/lb and Peru is c. 100c/lb.
3. Unit cost is per own mined 5E + gold PGMs metal in concentrate ounce.
4. Wet basis. Total iron ore unit cost is the weighted average of Kumba and Minas-Rio based on actual production or the mid-point of production guidance. 2022 unit cost for Kumba is $40/t and for Minas-Rio is $35/t. 2023F unit cost guidance
for Kumba is c.$44/t and Minas-Rio is c.$32/t.
5. Steelmaking Coal FOB/t unit cost comprises managed operations and excludes royalties and study costs.
Anglo American
46View entire presentation