IGI SPAC Presentation Deck
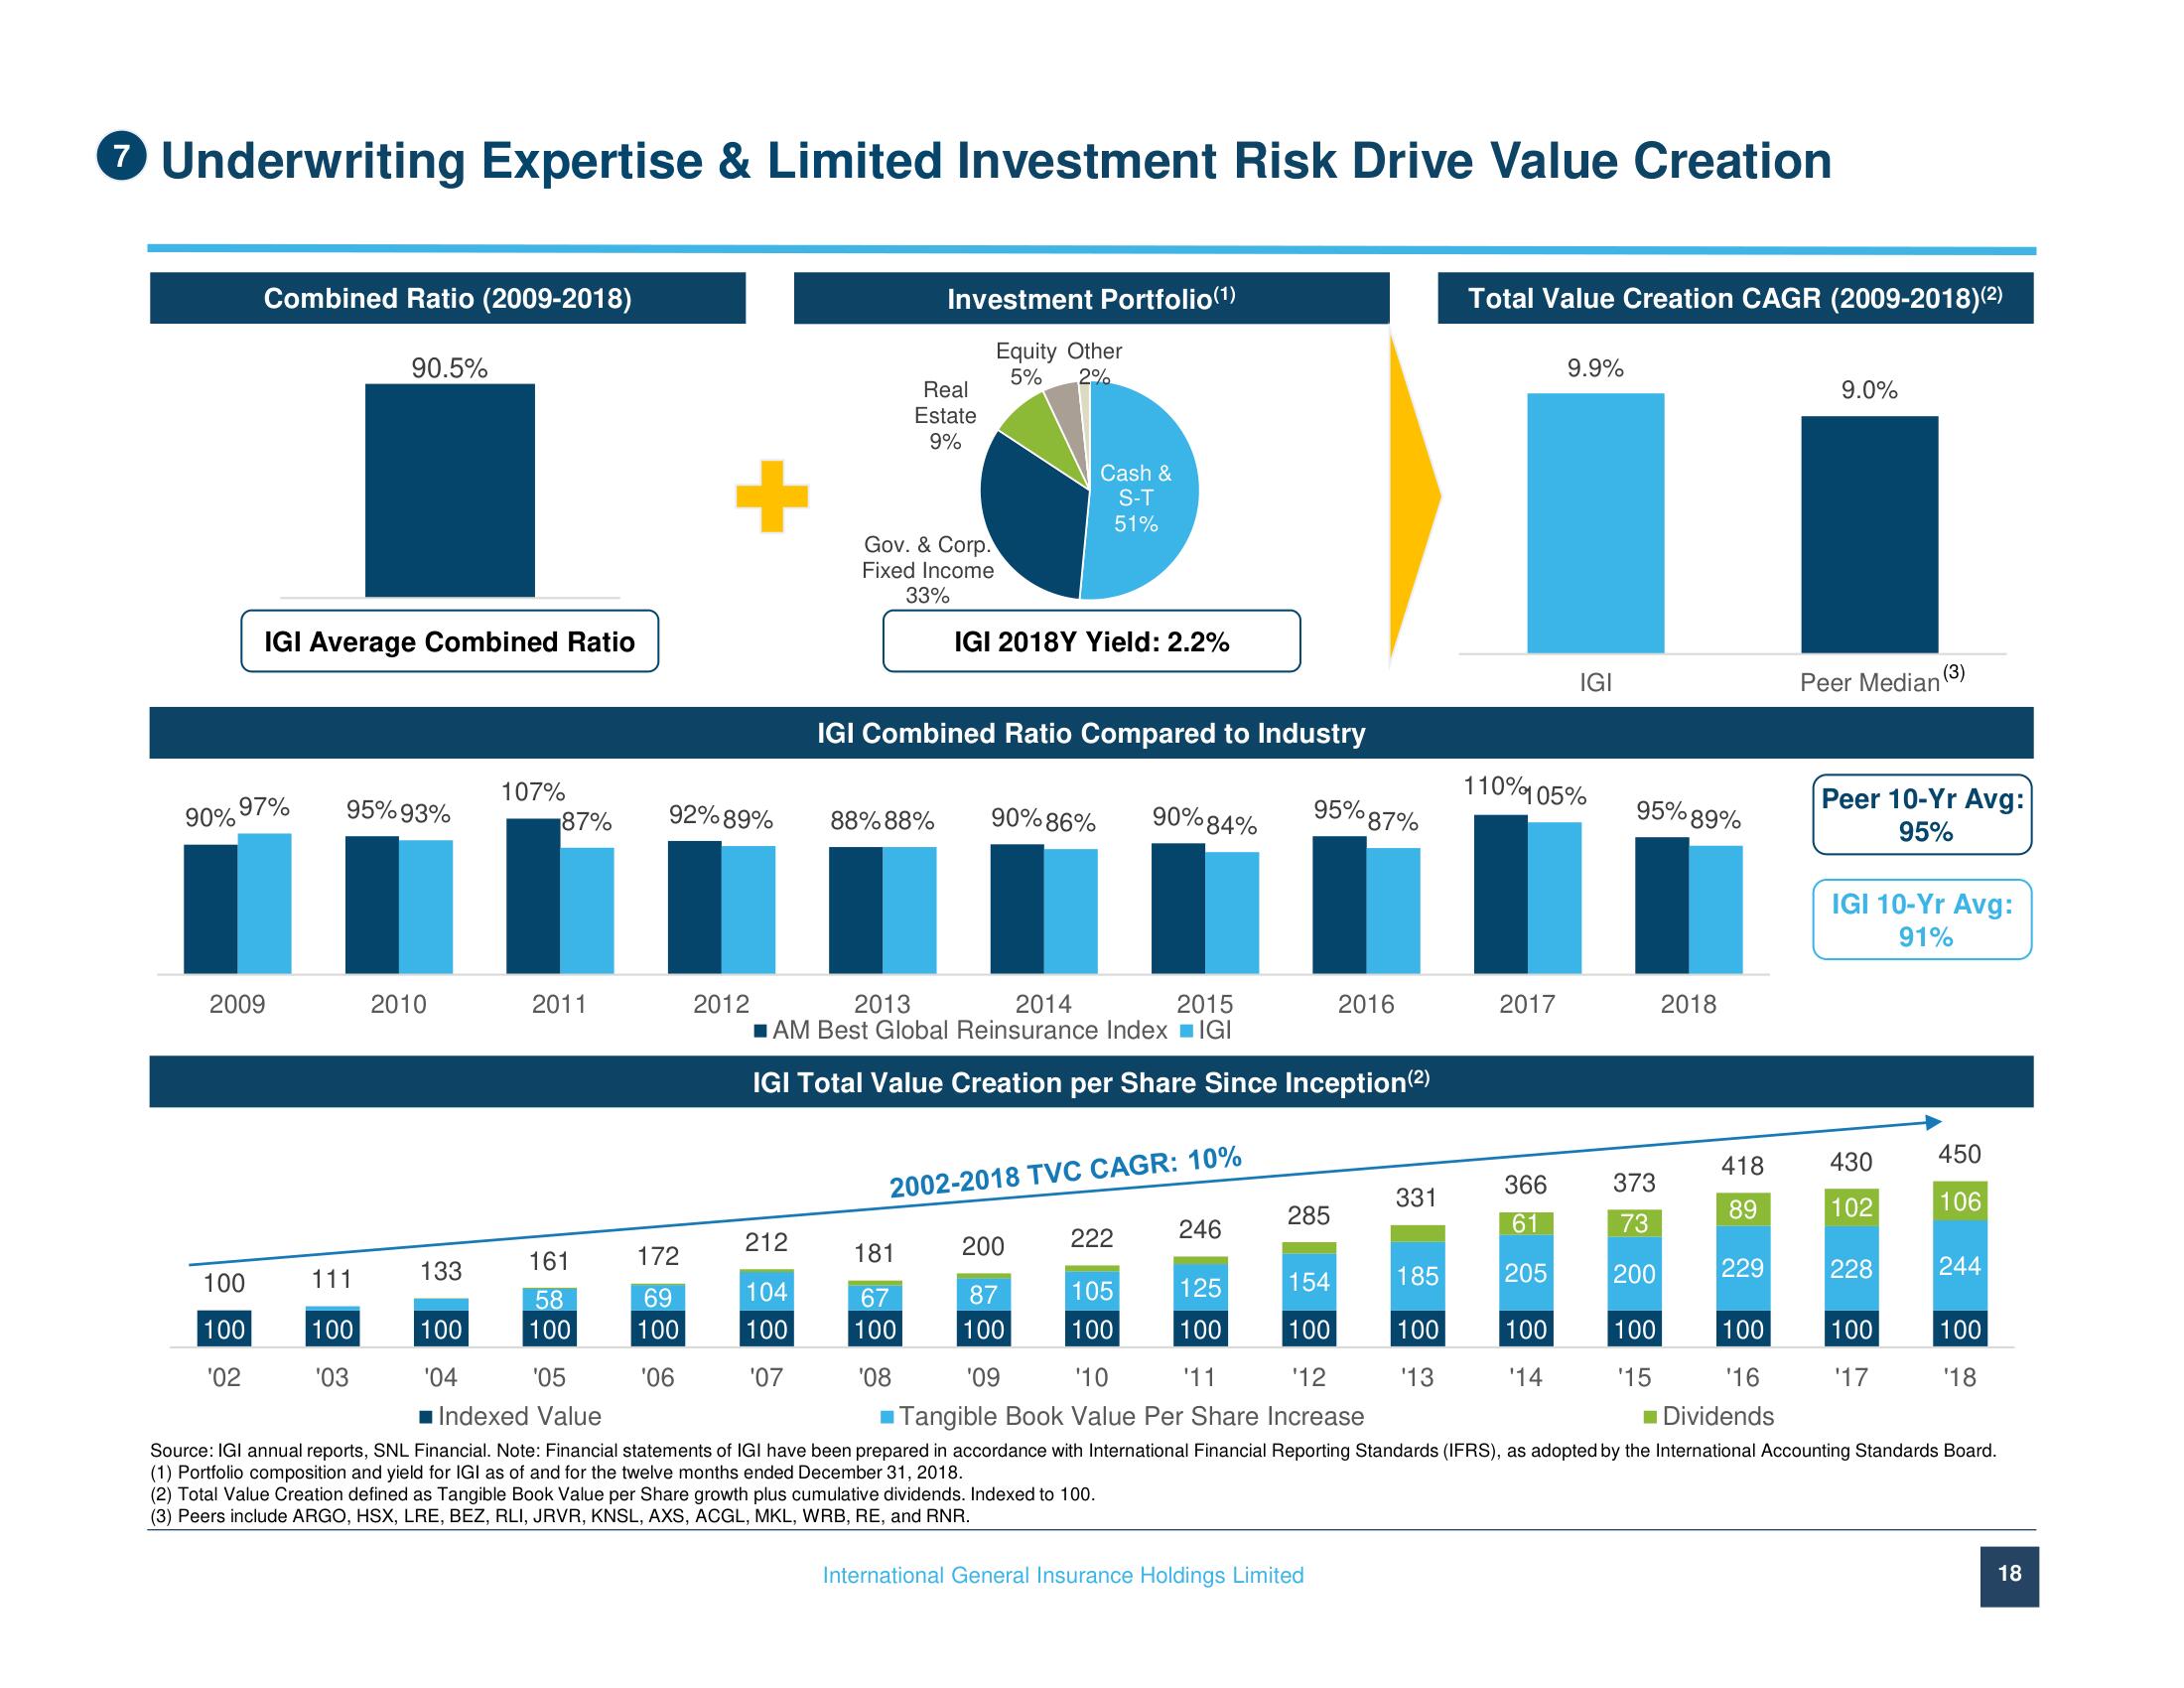
7 Underwriting Expertise & Limited Investment Risk Drive Value Creation
Combined Ratio (2009-2018)
90% 97%
IGI Average Combined Ratio
2009
100
100
'02
90.5%
95%93%
111
100
'03
2010
133
107%
100
'04
87%
2011
92%89%
2012
172
69
100
'06
212
104
100
'07
Investment Portfolio(1)
Equity Other
5% 2%
Real
Estate
9%
Gov. & Corp.
Fixed Income
33%
88%88%
IGI Combined Ratio Compared to Industry
Cash &
S-T
51%
IGI 2018Y Yield: 2.2%
181
67
100
'08
90%86%
2013
2014
2015
■AM Best Global Reinsurance Index■IGI
IGI Total Value Creation per Share Since Inception (²)
2002-2018 TVC CAGR: 10%
90%84%
222
105
100
246
95%87%
125
100
285
2016
International General Insurance Holdings Limited
331
Total Value Creation CAGR (2009-2018)(²)
185
100
'13
110%105%
2017
9.9%
I
366
61
205
IGI
100
'14
95% 89%
200
161
154
58
87
100
100
100
100
'05
'10
'11
'12
'16
'09
Tangible Book Value Per Share Increase
■Indexed Value
■ Dividends
Source: IGI annual reports, SNL Financial. Note: Financial statements of IGI have been prepared in accordance with International Financial Reporting Standards (IFRS), as adopted by the International Accounting Standards Board.
(1) Portfolio composition and yield for IGI as of and for the twelve months ended December 31, 2018.
(2) Total Value Creation defined as Tangible Book Value per Share growth plus cumulative dividends. Indexed to 100.
(3) Peers include ARGO, HSX, LRE, BEZ, RLI, JRVR, KNSL, AXS, ACGL, MKL, WRB, RE, and RNR.
373
73
200
2018
100
'15
418
89
9.0%
229
Peer Median
Peer 10-Yr Avg:
95%
IGI 10-Yr Avg:
91%
430
102
(3)
228
100
'17
450
106
244
100
'18
18View entire presentation