Uber Results Presentation Deck
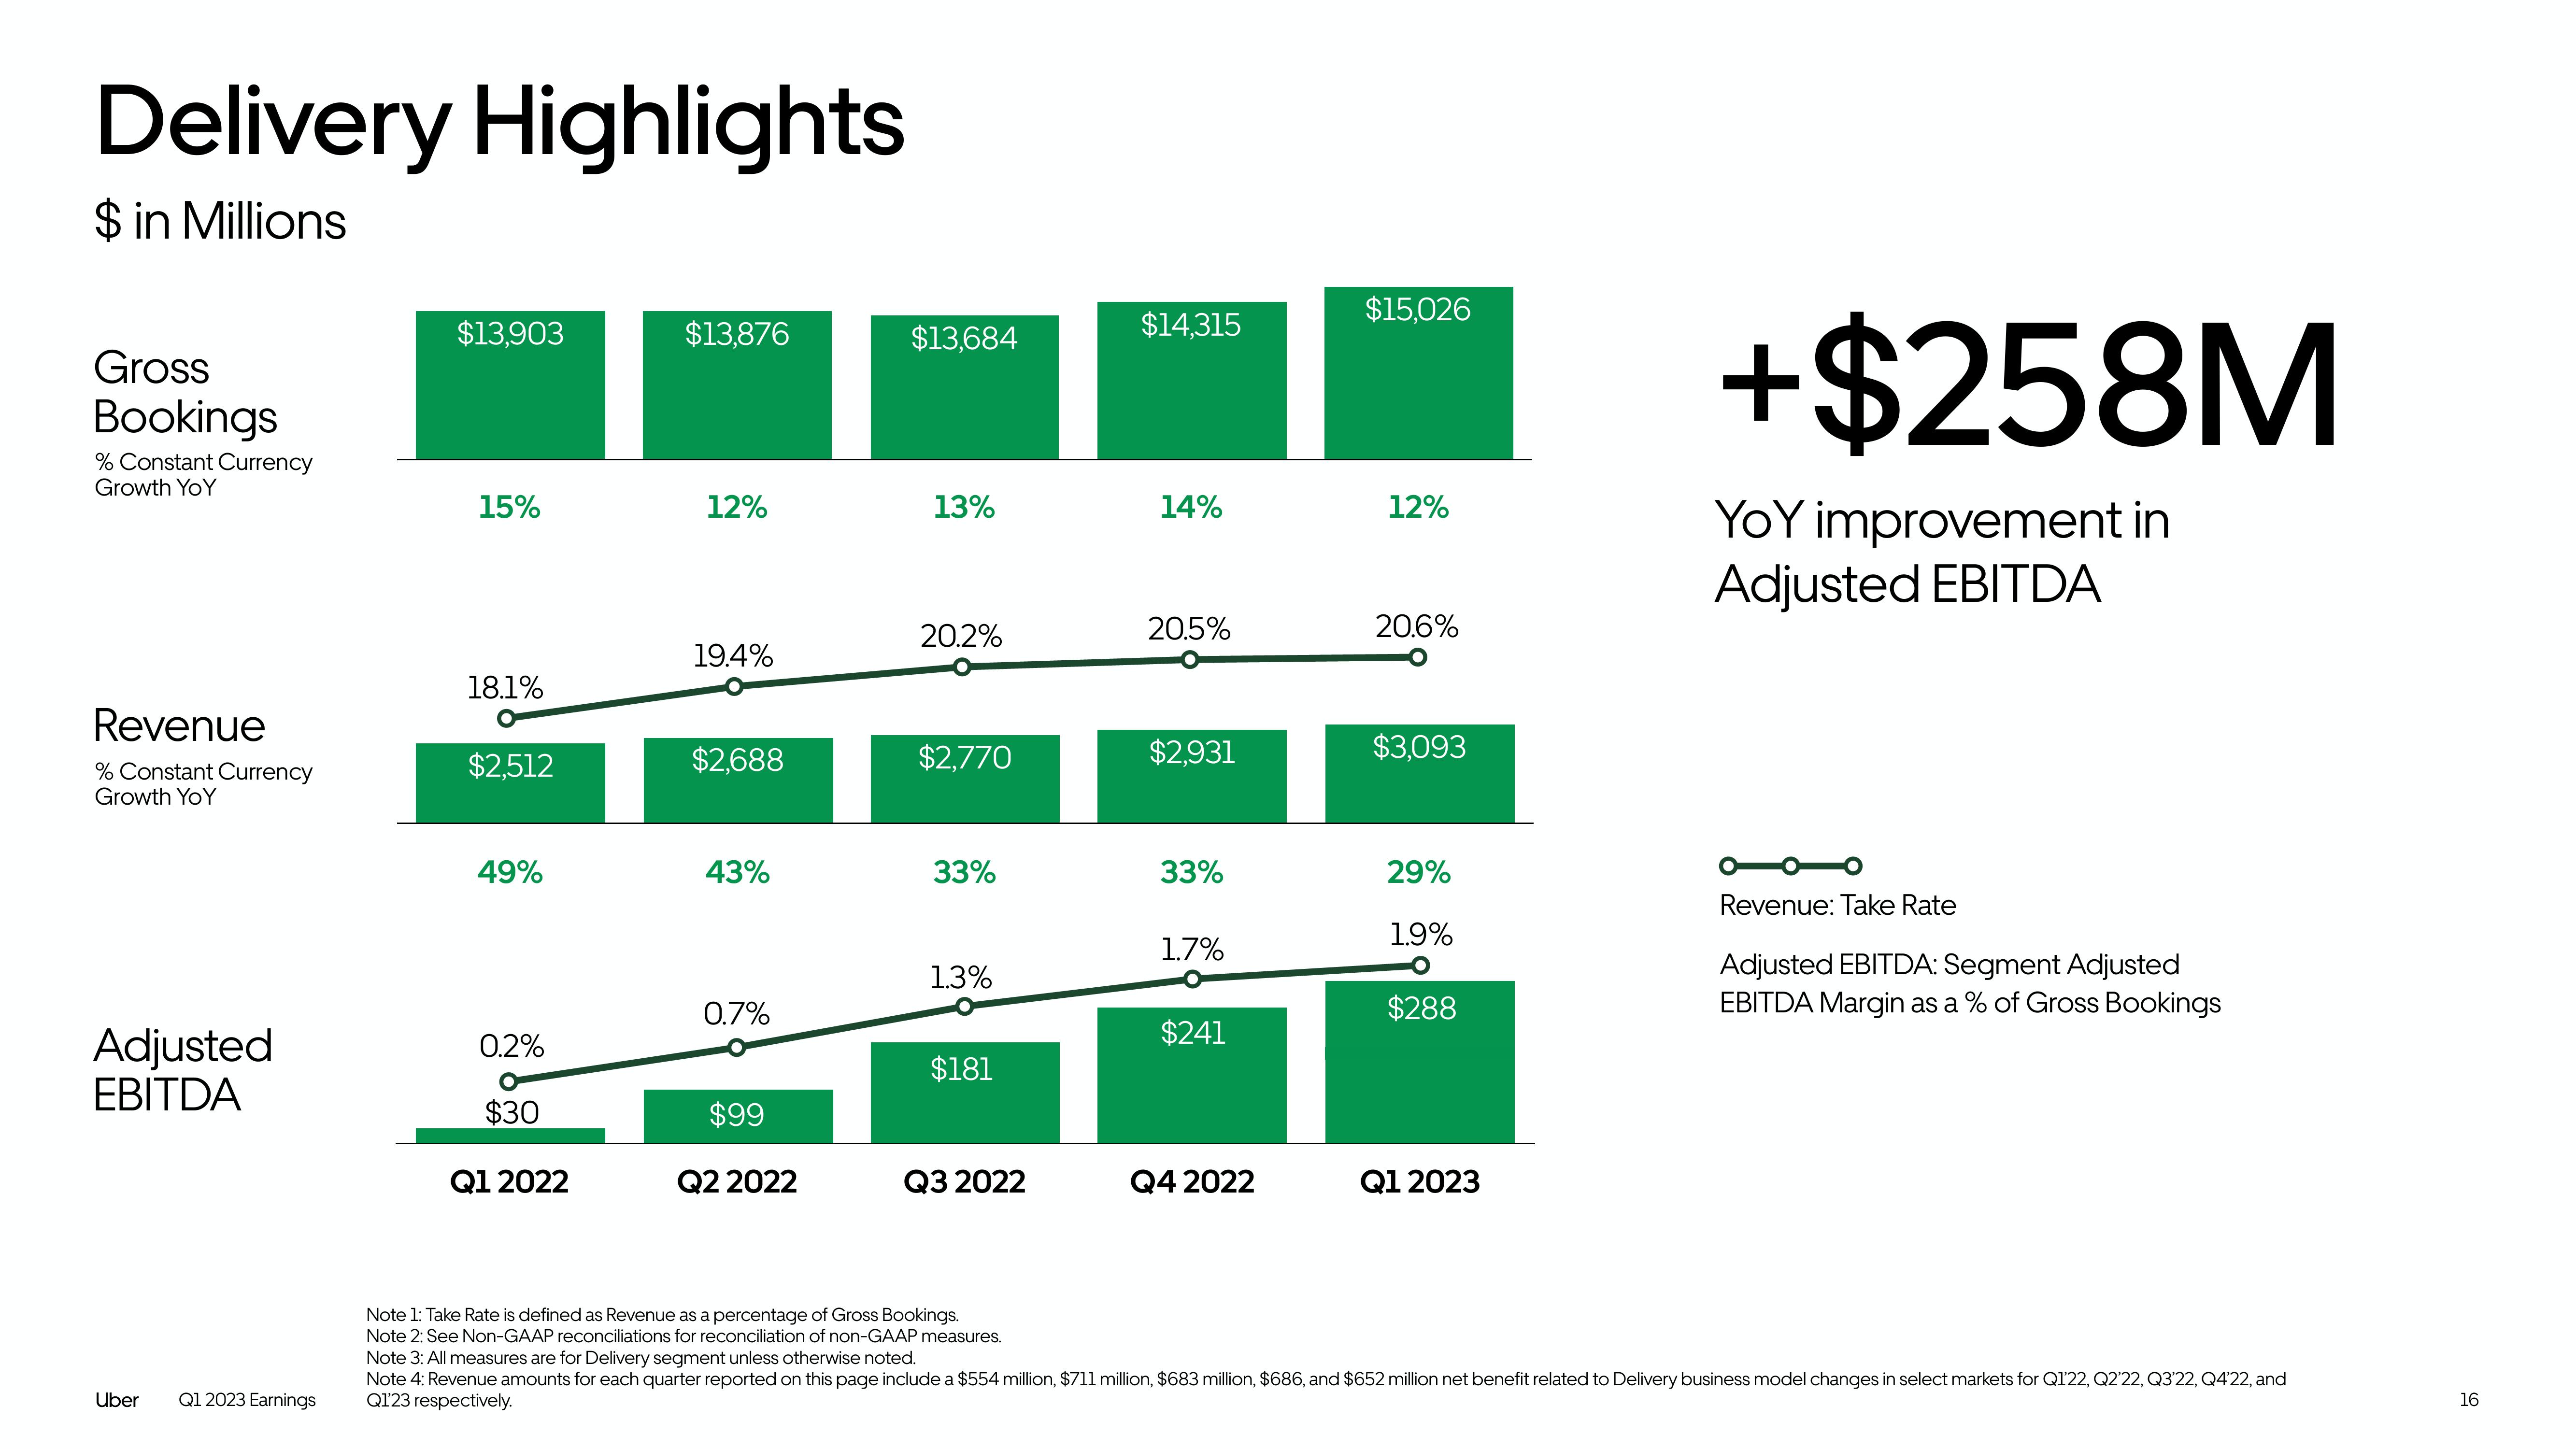
Delivery Highlights
$ in Millions
Gross
Bookings
% Constant Currency
Growth YoY
Revenue
% Constant Currency
Growth YoY
Adjusted
EBITDA
Uber
Q1 2023 Earnings
$13,903
15%
18.1%
$2,512
49%
0.2%
O
$30
Q1 2022
$13,876
12%
19.4%
$2,688
43%
0.7%
$99
Q2 2022
$13,684
13%
20.2%
$2,770
33%
1.3%
$181
Q3 2022
Note 1: Take Rate is defined as Revenue as a percentage of Gross Bookings.
Note 2: See Non-GAAP reconciliations for reconciliation of non-GAAP measures.
$14,315
14%
20.5%
$2,931
33%
1.7%
$241
Q4 2022
$15,026
12%
20.6%
$3,093
29%
1.9%
$288
Q1 2023
+$258M
YoY improvement in
Adjusted EBITDA
Revenue: Take Rate
Adjusted EBITDA: Segment Adjusted
EBITDA Margin as a % of Gross Bookings
Note 3: All measures are for Delivery segment unless otherwise noted.
Note 4: Revenue amounts for each quarter reported on this page include a $554 million, $711 million, $683 million, $686, and $652 million net benefit related to Delivery business model changes in select markets for Q1'22, Q2'22, Q3'22, Q4'22, and
Q1'23 respectively.
16View entire presentation