Oatly Results Presentation Deck
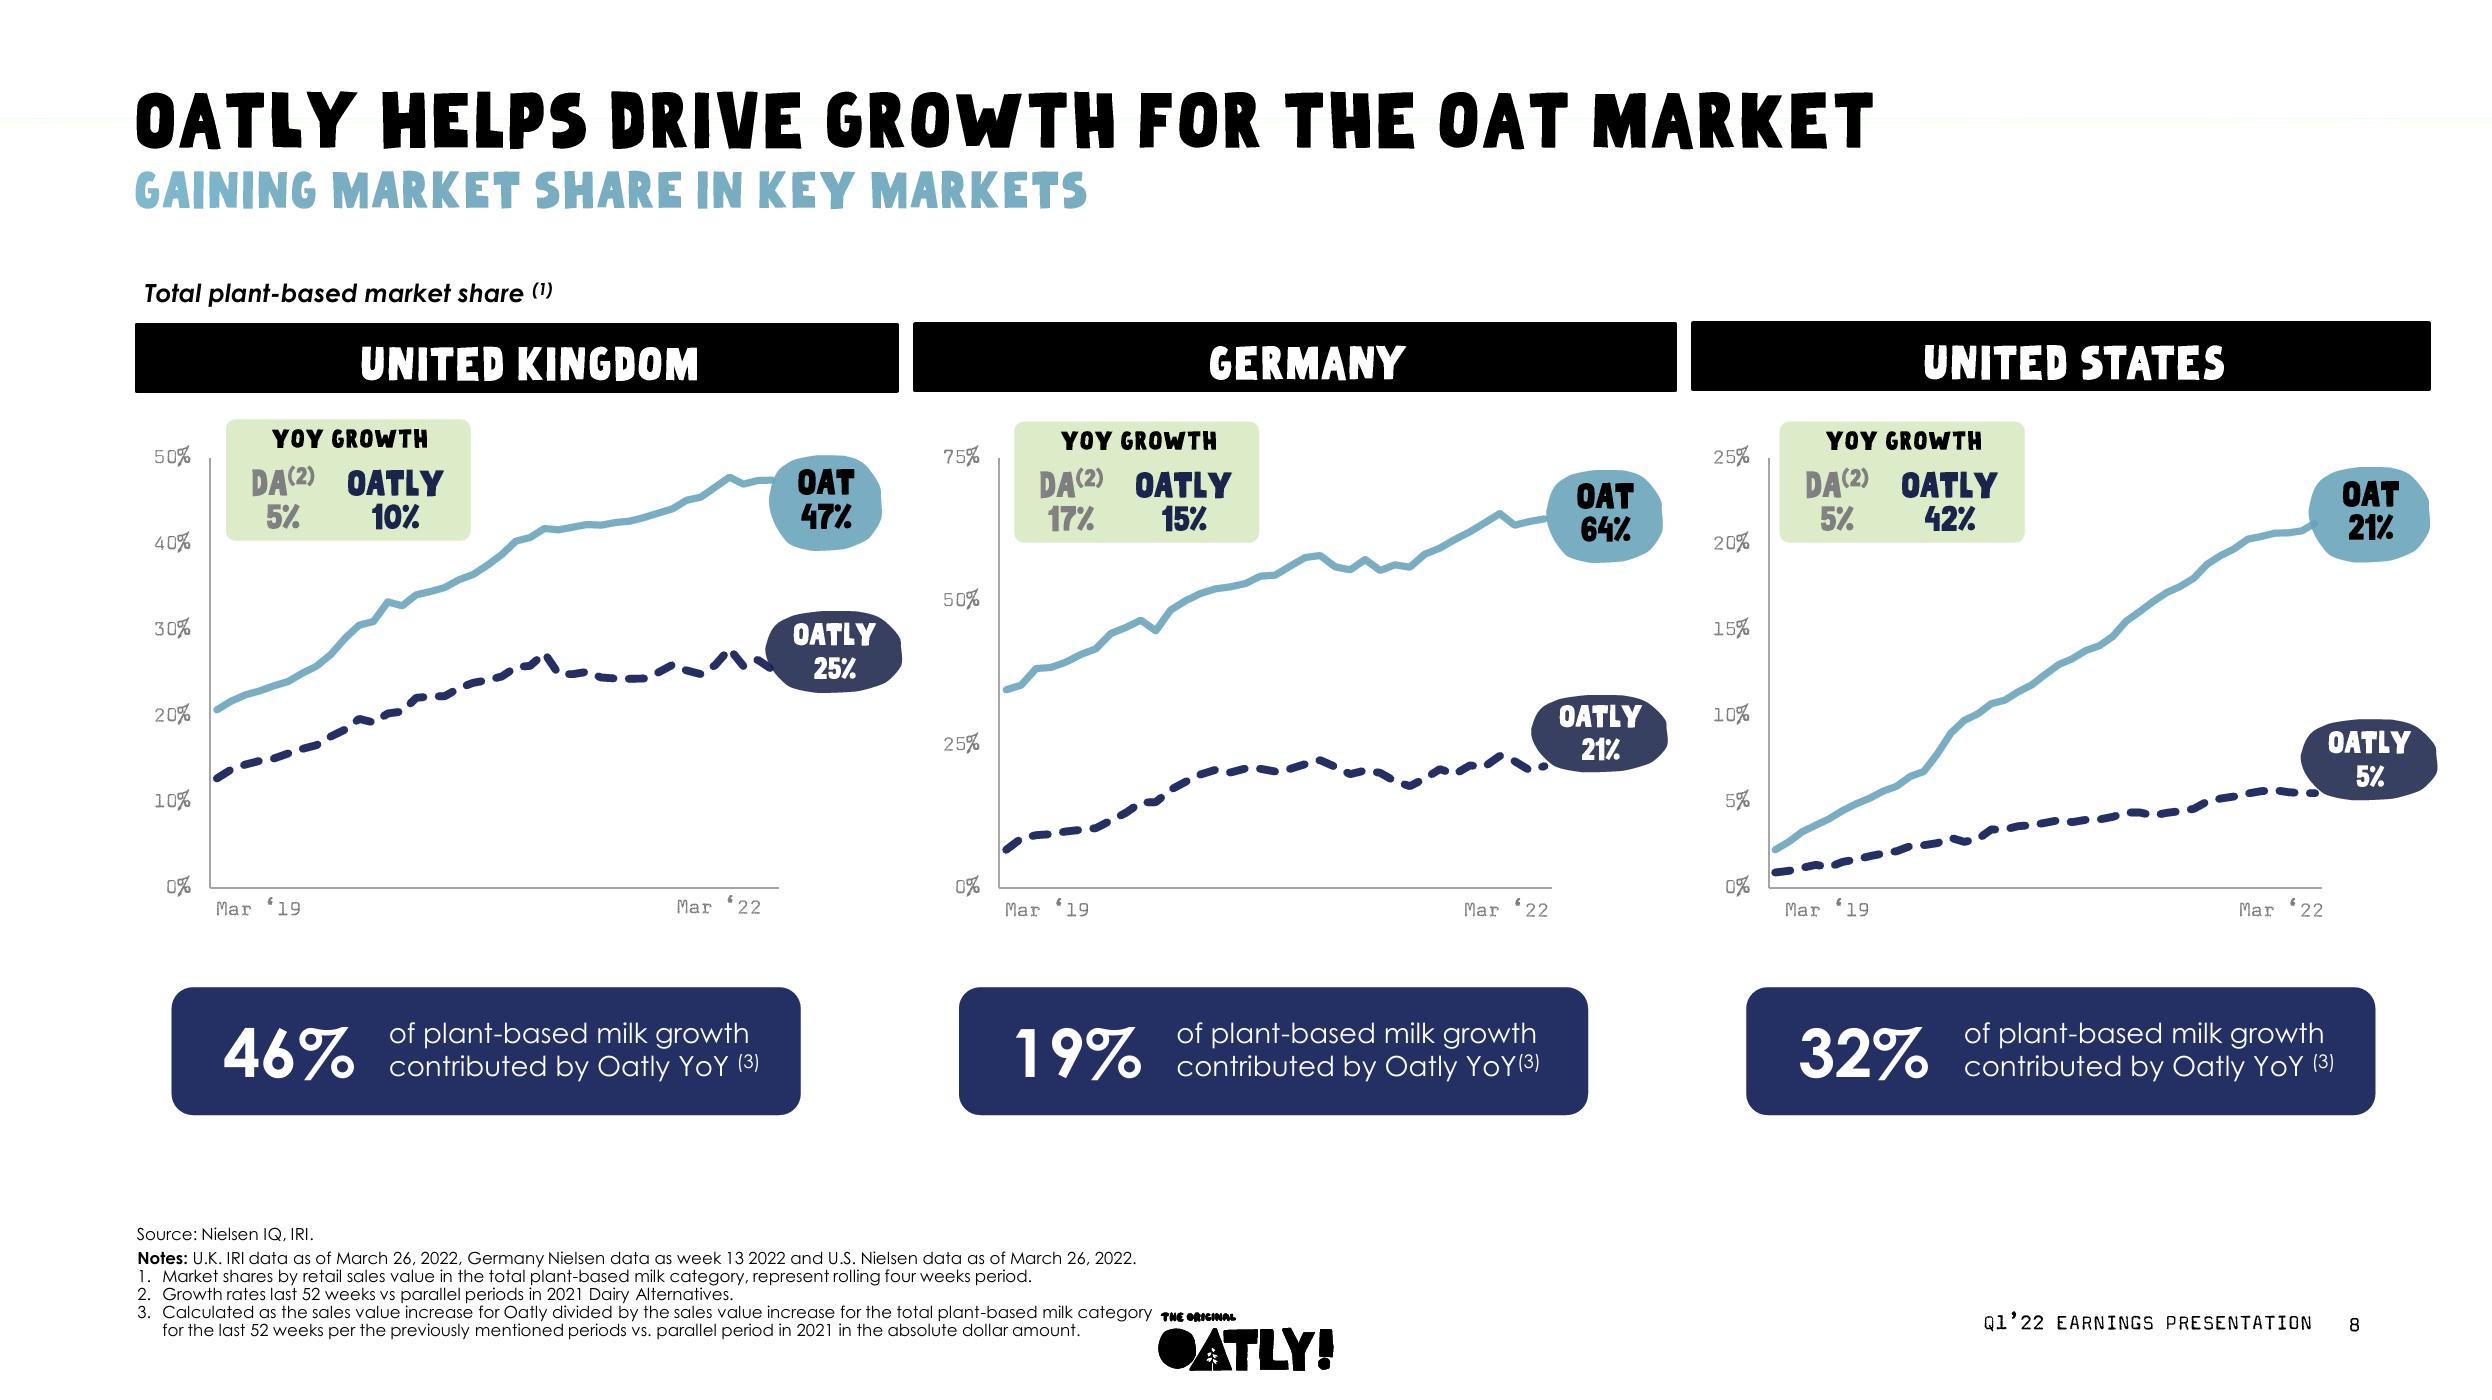
OATLY HELPS DRIVE GROWTH FOR THE OAT MARKET
GAINING MARKET SHARE IN KEY MARKETS
Total plant-based market share (¹)
50%
40%
30%
20%
10%
0%
YOY GROWTH
DA(2) OATLY
5%
10%
Mar 19
UNITED KINGDOM
46%
Mar 22
of plant-based milk growth
contributed by Oatly YoY (3)
OAT
47%
OATLY
25%
75%
50%
25%
0%
GERMANY
YOY GROWTH
DA(2) OATLY
17%
15%
Mar '19
Mar 22
of plant-based milk growth
19% contributed by Oatly YoY (3)
Source: Nielsen IQ, IRI.
Notes: U.K. IRI data as of March 26, 2022, Germany Nielsen data as week 13 2022 and U.S. Nielsen data as of March 26, 2022.
1. Market shares by retail sales value in the total plant-based milk category, represent rolling four weeks period.
2. Growth rates last 52 weeks vs parallel periods in 2021 Dairy Alternatives.
3. Calculated as the sales value increase for Oatly divided by the sales value increase for the total plant-based milk category THE ORIGINAL
for the last 52 weeks per the previously mentioned periods vs. parallel period in 2021 in the absolute dollar amount.
●ATLY!
OAT
64%
OATLY
21%
25%
20%
15%
10%
5%
0%
UNITED STATES
YOY GROWTH
DA(2) OATLY
5%
42%
Mar '19
Mar 22
OAT
21%
OATLY
5%
of plant-based milk growth
32% contributed by Oatly YoY (3)
Q1'22 EARNINGS PRESENTATION 8View entire presentation