Credit Suisse Results Presentation Deck
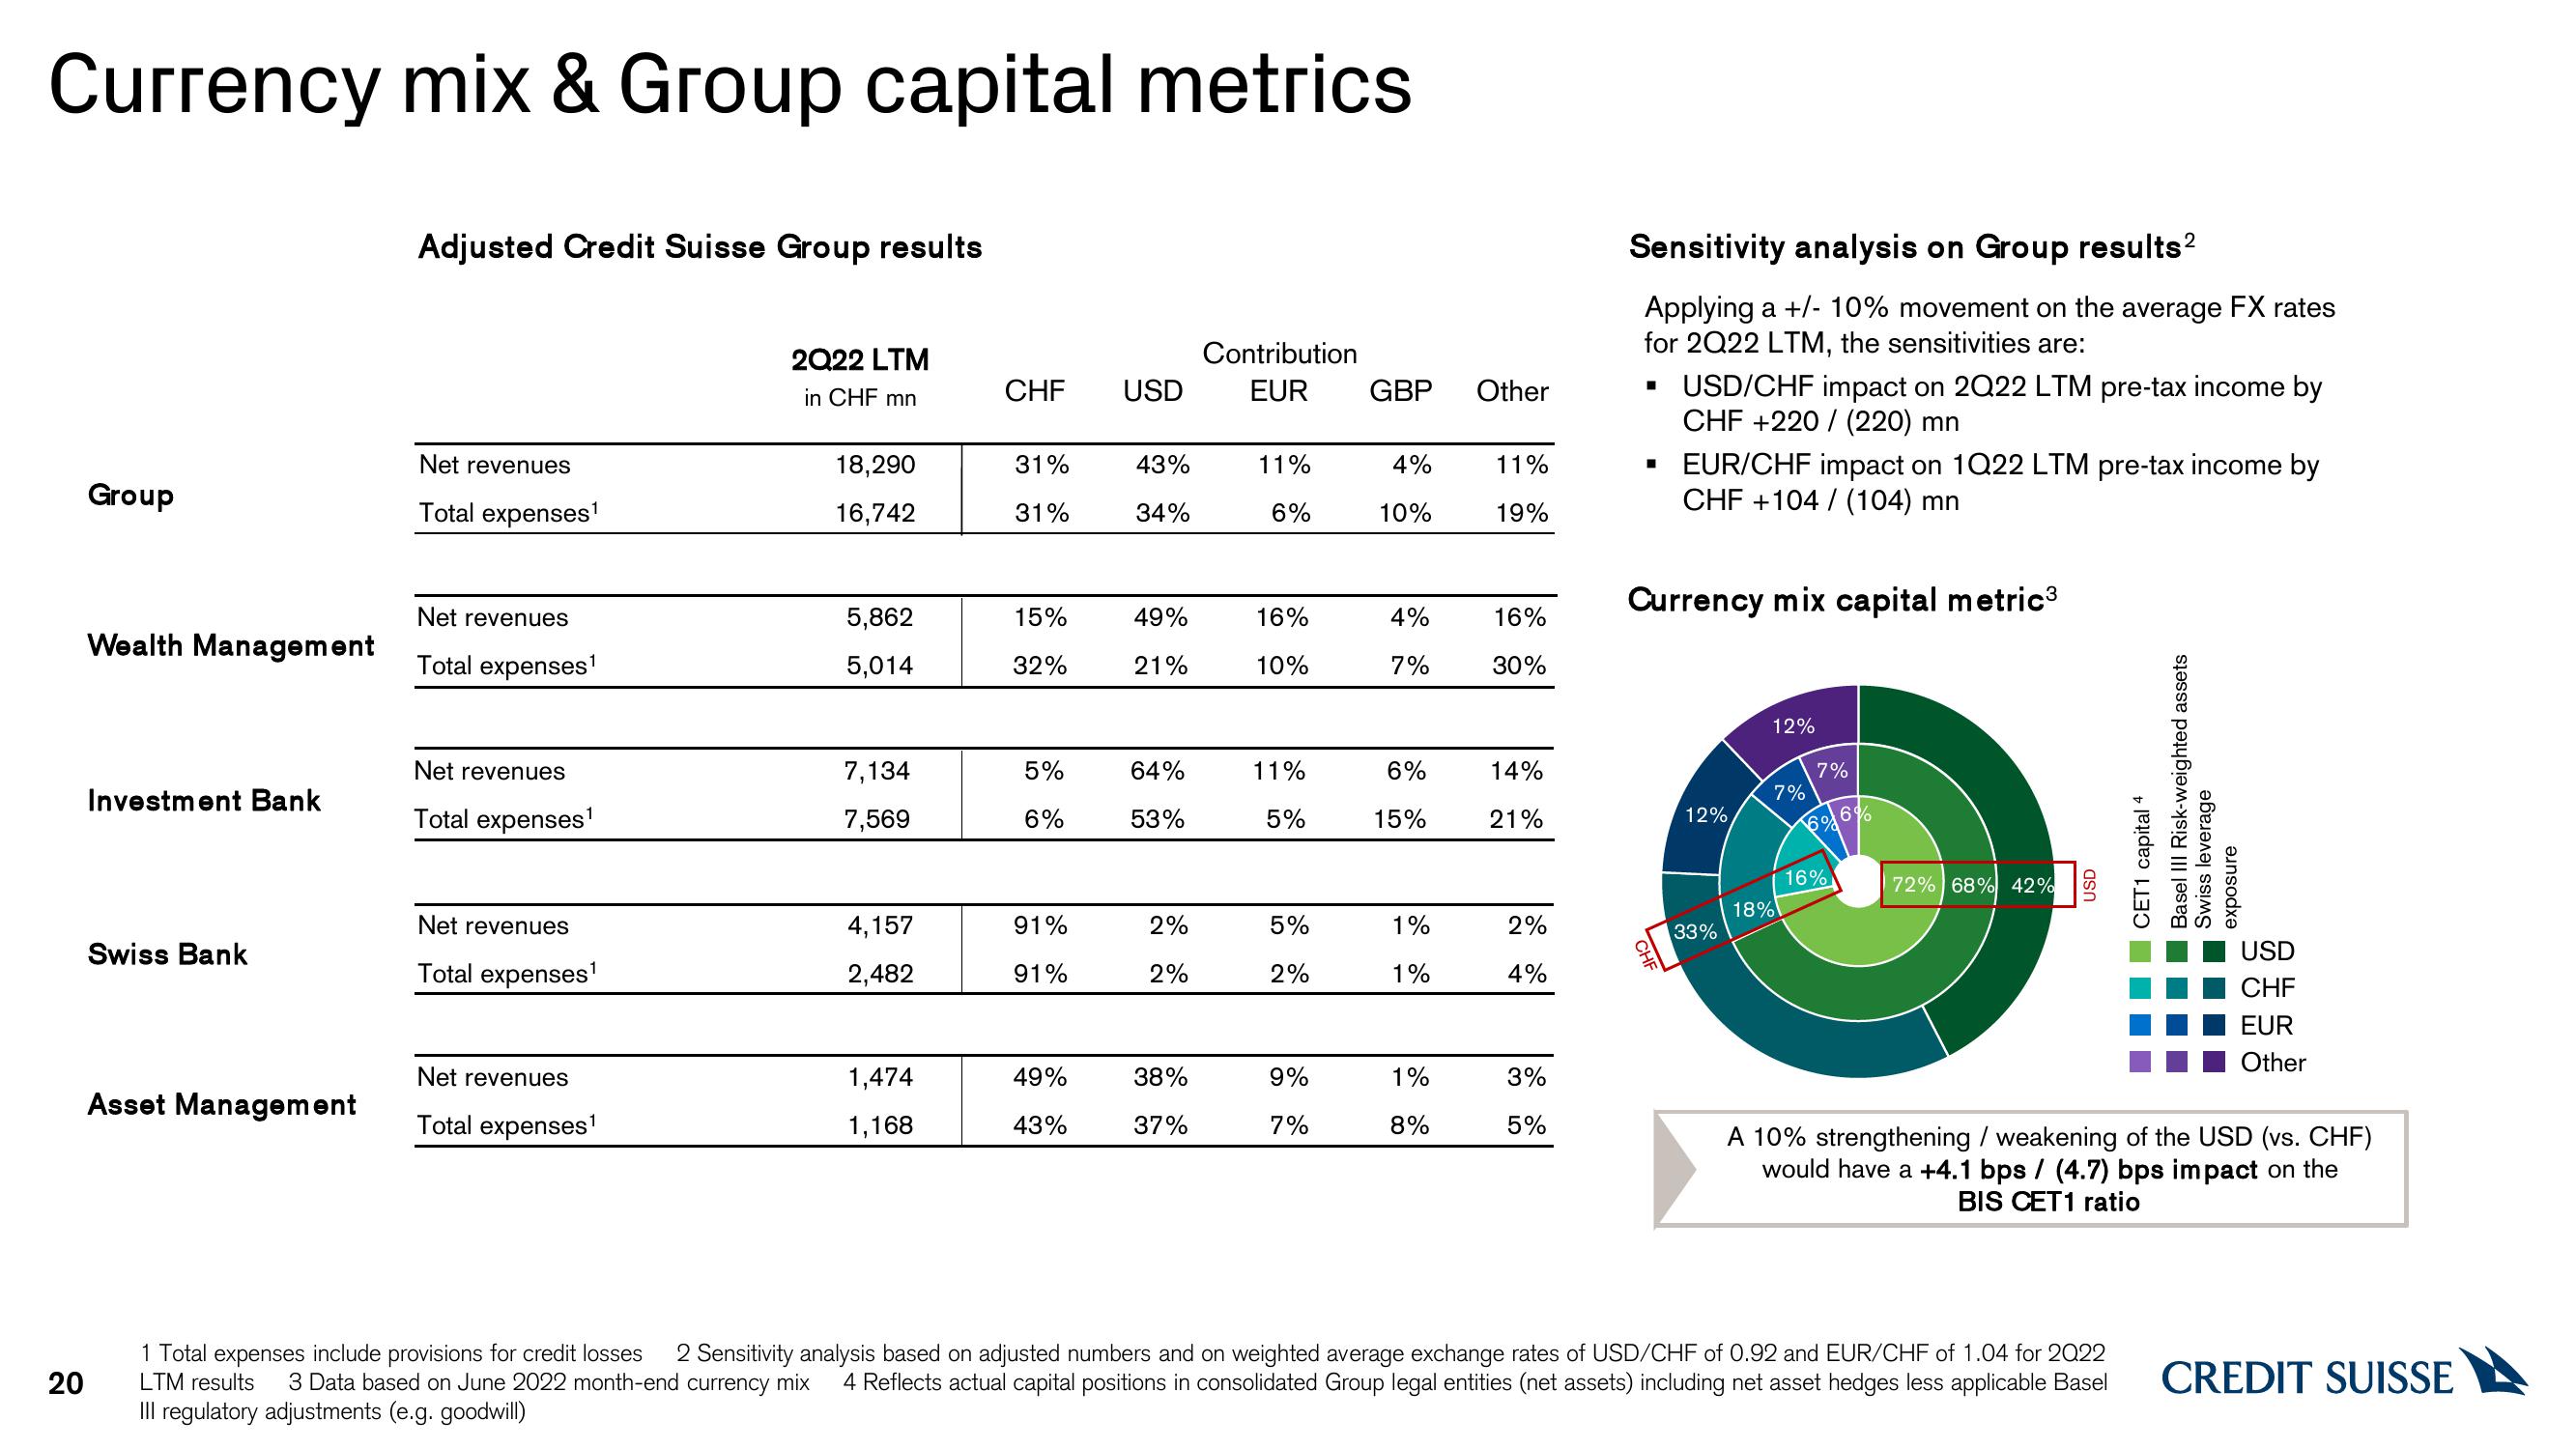
Currency mix & Group capital metrics
20
Group
Wealth Management
Investment Bank
Swiss Bank
Asset Management
Adjusted Credit Suisse Group results
Net revenues
Total expenses¹
Net revenues
Total expenses1¹
Net revenues
Total expenses1¹
Net revenues
Total expenses¹
Net revenues
Total expenses¹
2Q22 LTM
in CHF mn
18,290
16,742
5,862
5,014
7,134
7,569
4,157
2,482
1,474
1,168
CHF
31%
31%
15%
32%
5%
6%
91%
91%
49%
43%
USD
43%
34%
49%
21%
64%
53%
2%
2%
38%
37%
Contribution
EUR GBP
11%
6%
16%
10%
11%
5%
5%
2%
9%
7%
4%
10%
4%
7%
6%
15%
1%
1%
1%
8%
Other
11%
19%
16%
30%
14%
21%
2%
4%
3%
5%
Sensitivity analysis on Group results²
Applying a +/- 10% movement on the average FX rates
for 2Q22 LTM, the sensitivities are:
▪ USD/CHF impact on 2Q22 LTM pre-tax income by
CHF +220 / (220) mn
▪ EUR/CHF impact on 1Q22 LTM pre-tax income by
CHF +104/(104) mn
Currency mix capital metric³
CHF
12%
33%
18%
12%
7%
616%
7%
16%
72% 68% 42%
USD
Basel III Risk-weighted assets
CET1 capital 4
Swiss leverage
exposure
1 Total expenses include provisions for credit losses 2 Sensitivity analysis based on adjusted numbers and on weighted average exchange rates of USD/CHF of 0.92 and EUR/CHF of 1.04 for 2022
3 Data based on June 2022 month-end currency mix 4 Reflects actual capital positions in consolidated Group legal entities (net assets) including net asset hedges less applicable Basel
III regulatory adjustments (e.g. goodwill)
LTM results
USD
CHF
EUR
Other
A 10% strengthening / weakening of the USD (vs. CHF)
would have a +4.1 bps / (4.7) bps impact on the
BIS CET1 ratio
CREDIT SUISSEView entire presentation