Nikola SPAC Presentation Deck
EXPECTED FCEV COSTS OF
GOODS SOLD
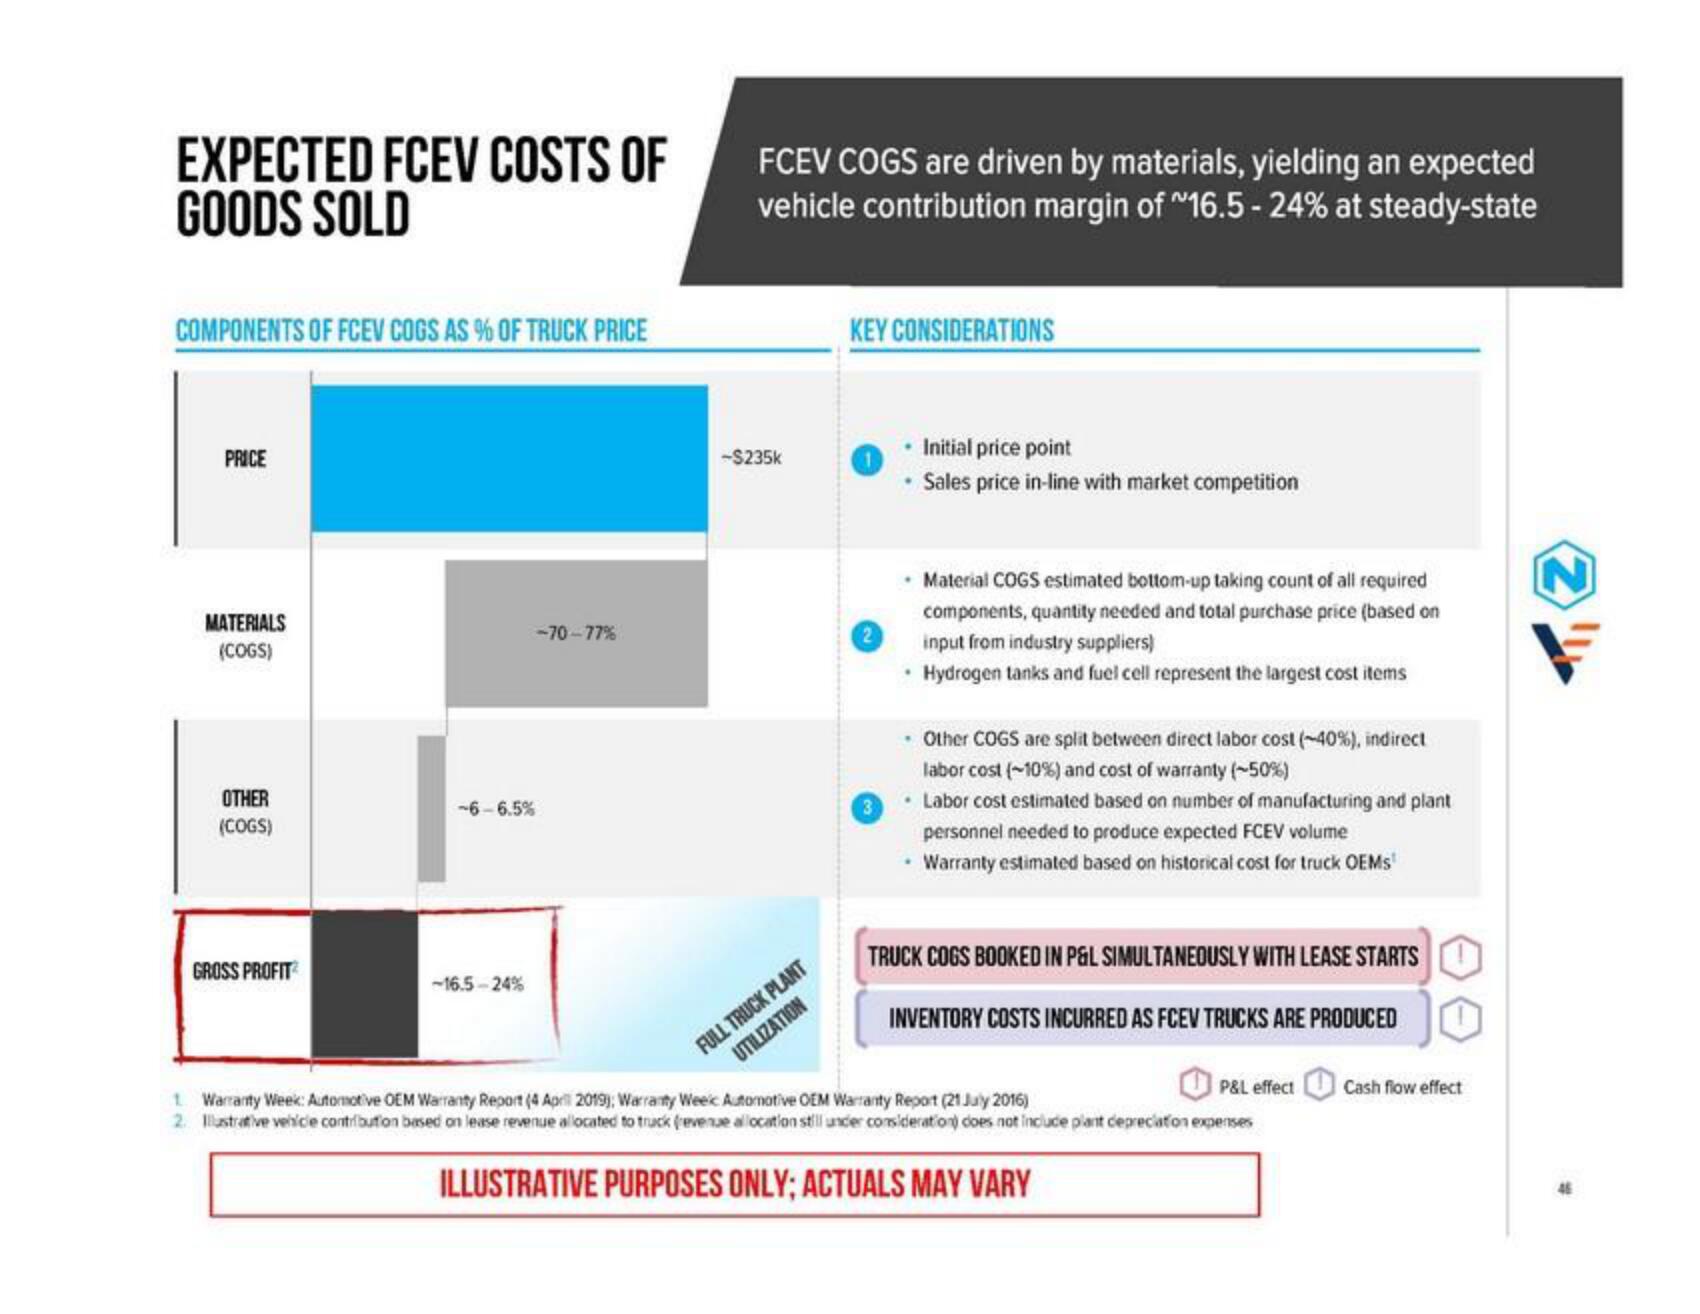
COMPONENTS OF FCEV COGS AS % OF TRUCK PRICE
PRICE
MATERIALS
(COGS)
OTHER
(COGS)
GROSS PROFIT
-6-6.5%
-16.5-24%
-70-77%
FCEV COGS are driven by materials, yielding an expected
vehicle contribution margin of "16.5 -24% at steady-state
-$235k
FULL TRUCK PLANT
UTILIZATION
KEY CONSIDERATIONS
• Initial price point
Sales price in-line with market competition
Material COGS estimated bottom-up taking count of all required
components, quantity needed and total purchase price (based on
input from industry suppliers)
• Hydrogen tanks and fuel cell represent the largest cost items
- Other COGS are split between direct labor cost (-40%), indirect
labor cost (-10%) and cost of warranty (-50%)
.
3
• Labor cost estimated based on number of manufacturing and plant
personnel needed to produce expected FCEV volume
• Warranty estimated based on historical cost for truck OEMs
TRUCK COGS BOOKED IN P&L SIMULTANEOUSLY WITH LEASE STARTS
INVENTORY COSTS INCURRED AS FCEV TRUCKS ARE PRODUCED
P&L effect
1 Warranty Week: Automotive OEM Warranty Report (4 April 2019); Warranty Weeic Automotive OEM Warranty Report (21 July 2016)
2. Illustrative vehicle contribution based on lease revenue allocated to truck (revenue allocation still under consideration) does not include plant depreciation expenses
ILLUSTRATIVE PURPOSES ONLY; ACTUALS MAY VARY
Cash flow effectView entire presentation