Kinnevik Results Presentation Deck
Intro
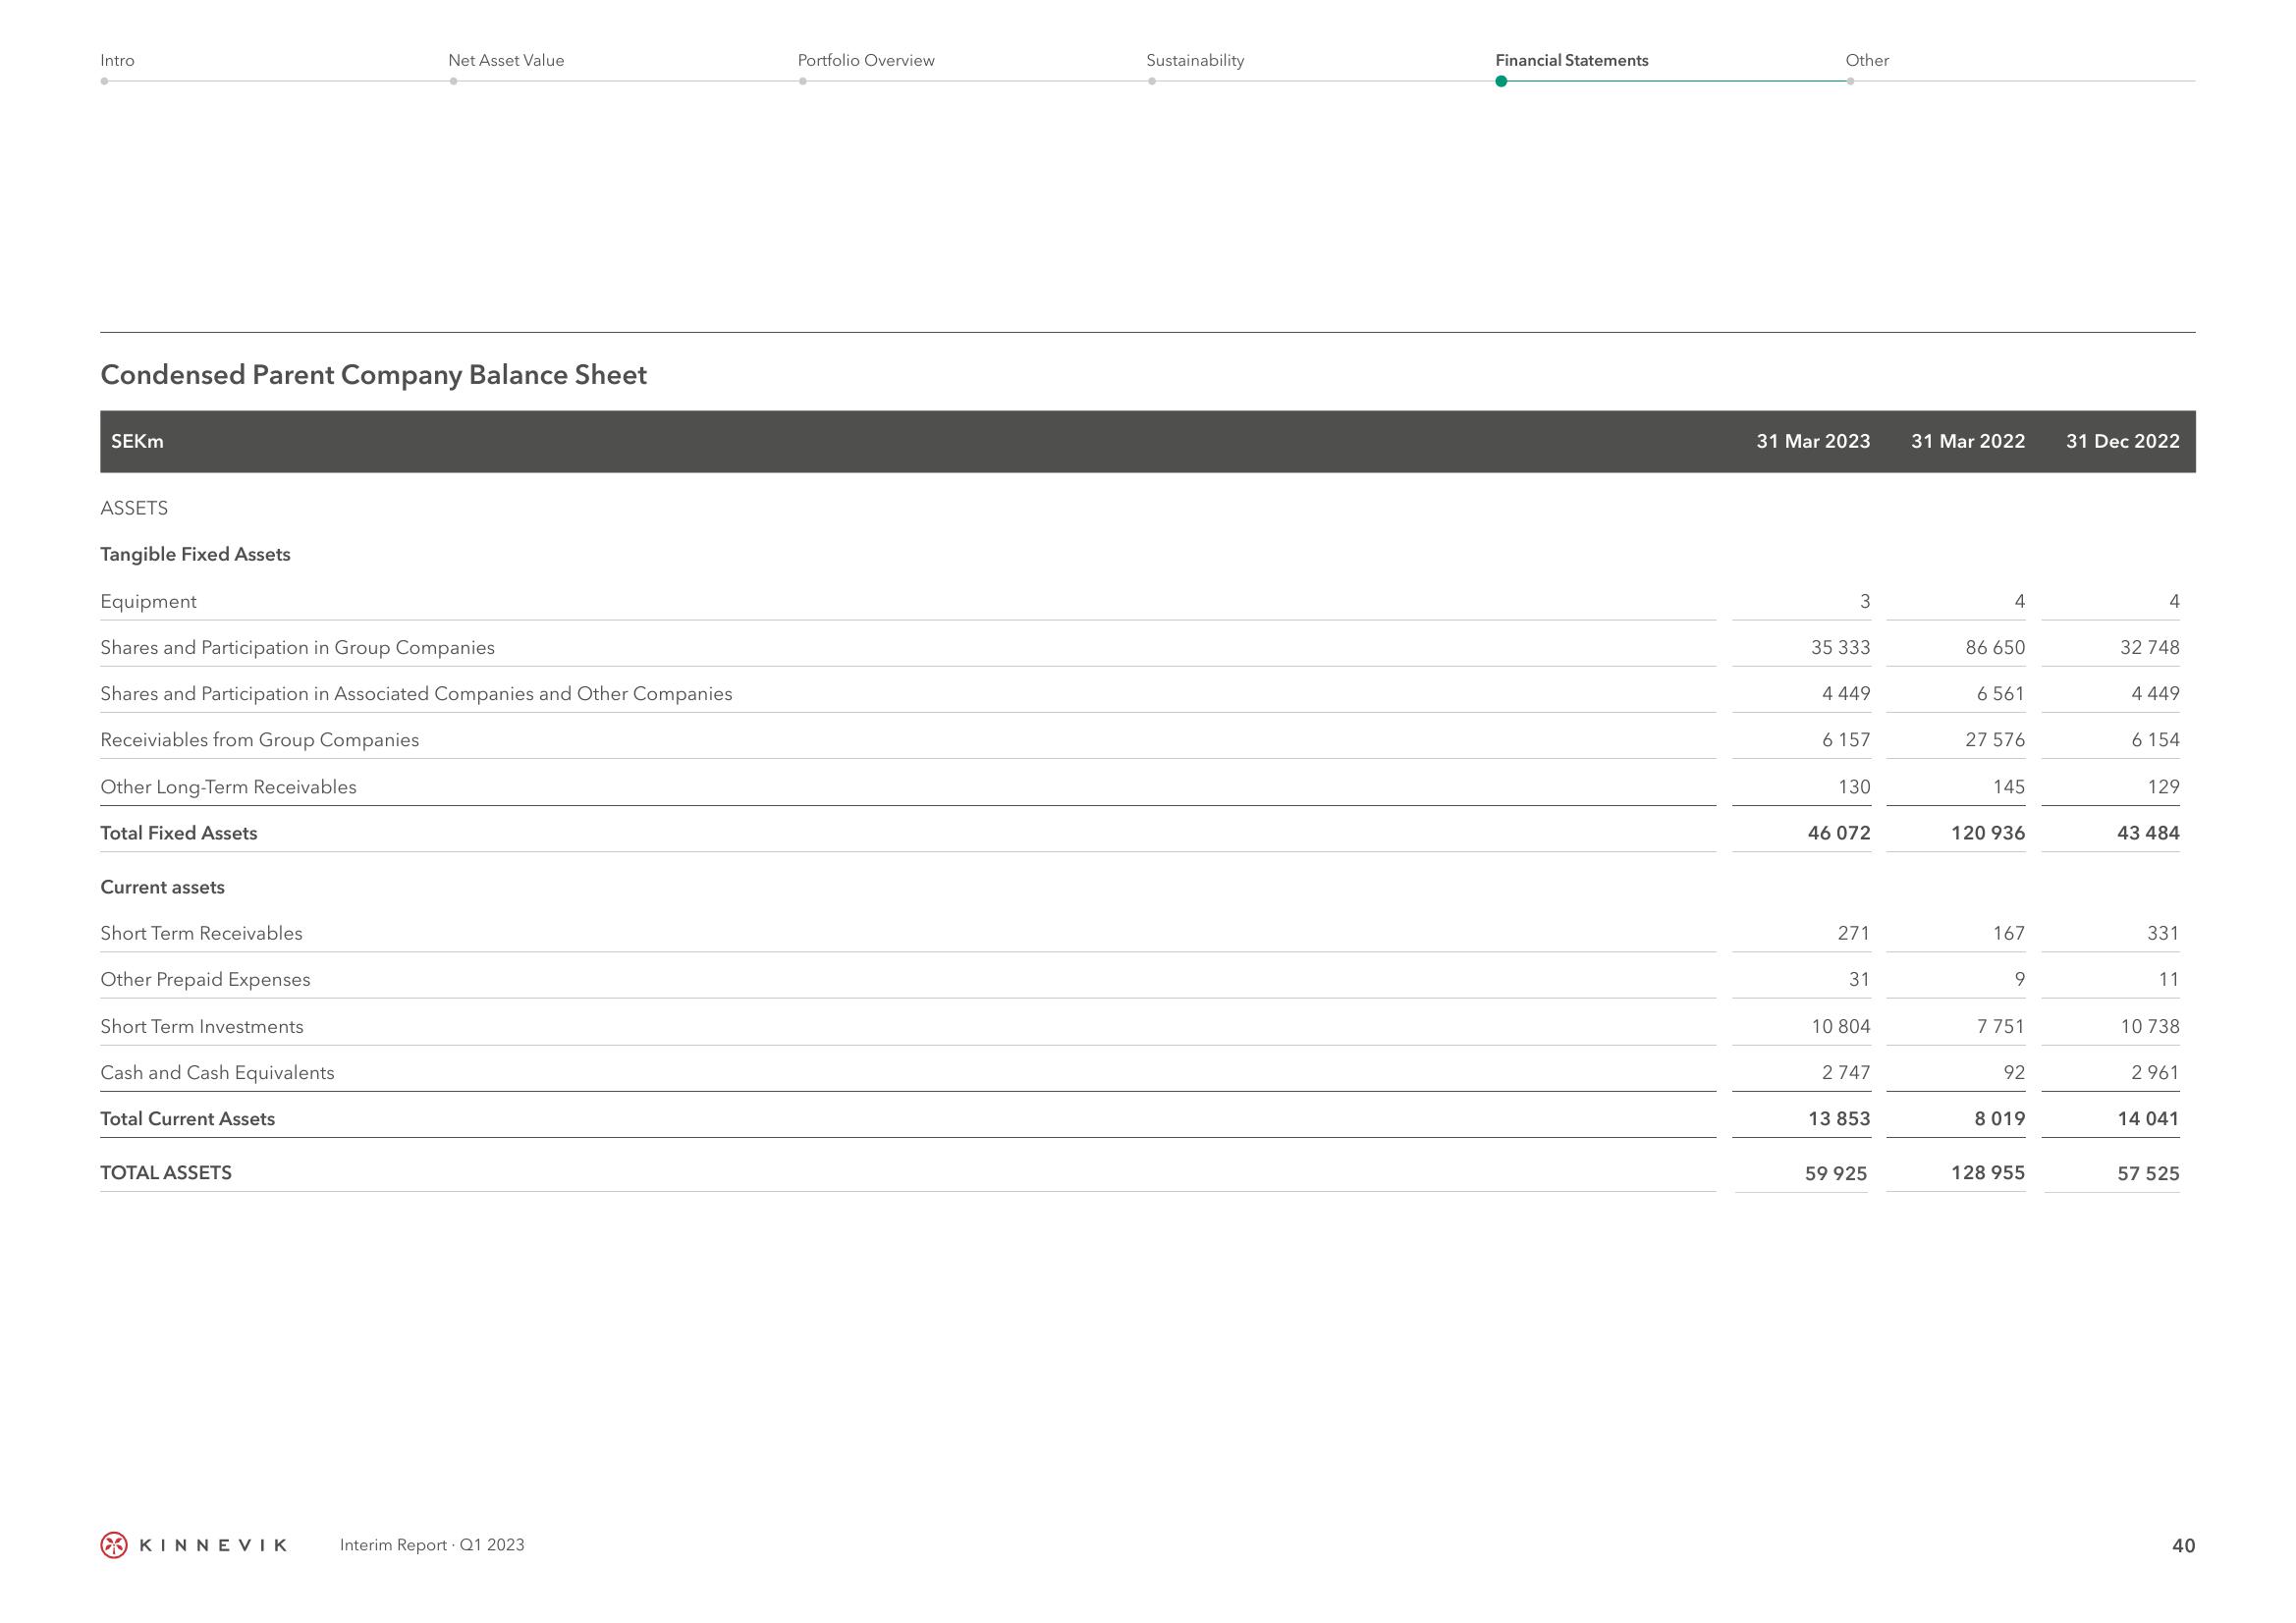
Condensed Parent Company Balance Sheet
SEKM
ASSETS
Tangible Fixed Assets
Equipment
Shares and Participation in Group Companies
Shares and Participation in Associated Companies and Other Companies
Receiviables from Group Companies
Other Long-Term Receivables
Total Fixed Assets
Current assets
Short Term Receivables
Other Prepaid Expenses
Short Term Investments
Cash and Cash Equivalents
Total Current Assets
Net Asset Value
TOTAL ASSETS
KINNEVIK
Interim Report Q1 2023
Portfolio Overview
Sustainability
Financial Statements
Other
31 Mar 2023
3
35 333
4 449
6 157
130
46 072
271
31
10 804
2747
13 853
59 925
31 Mar 2022
4
86 650
6561
27 576
145
120 936
167
9
7 751
92
8 019
128 955
31 Dec 2022
4
32 748
4 449
6 154
129
43 484
331
11
10 738
2961
14 041
57 525
40View entire presentation