Main Street Capital Investor Day Presentation Deck
% of total
% of total
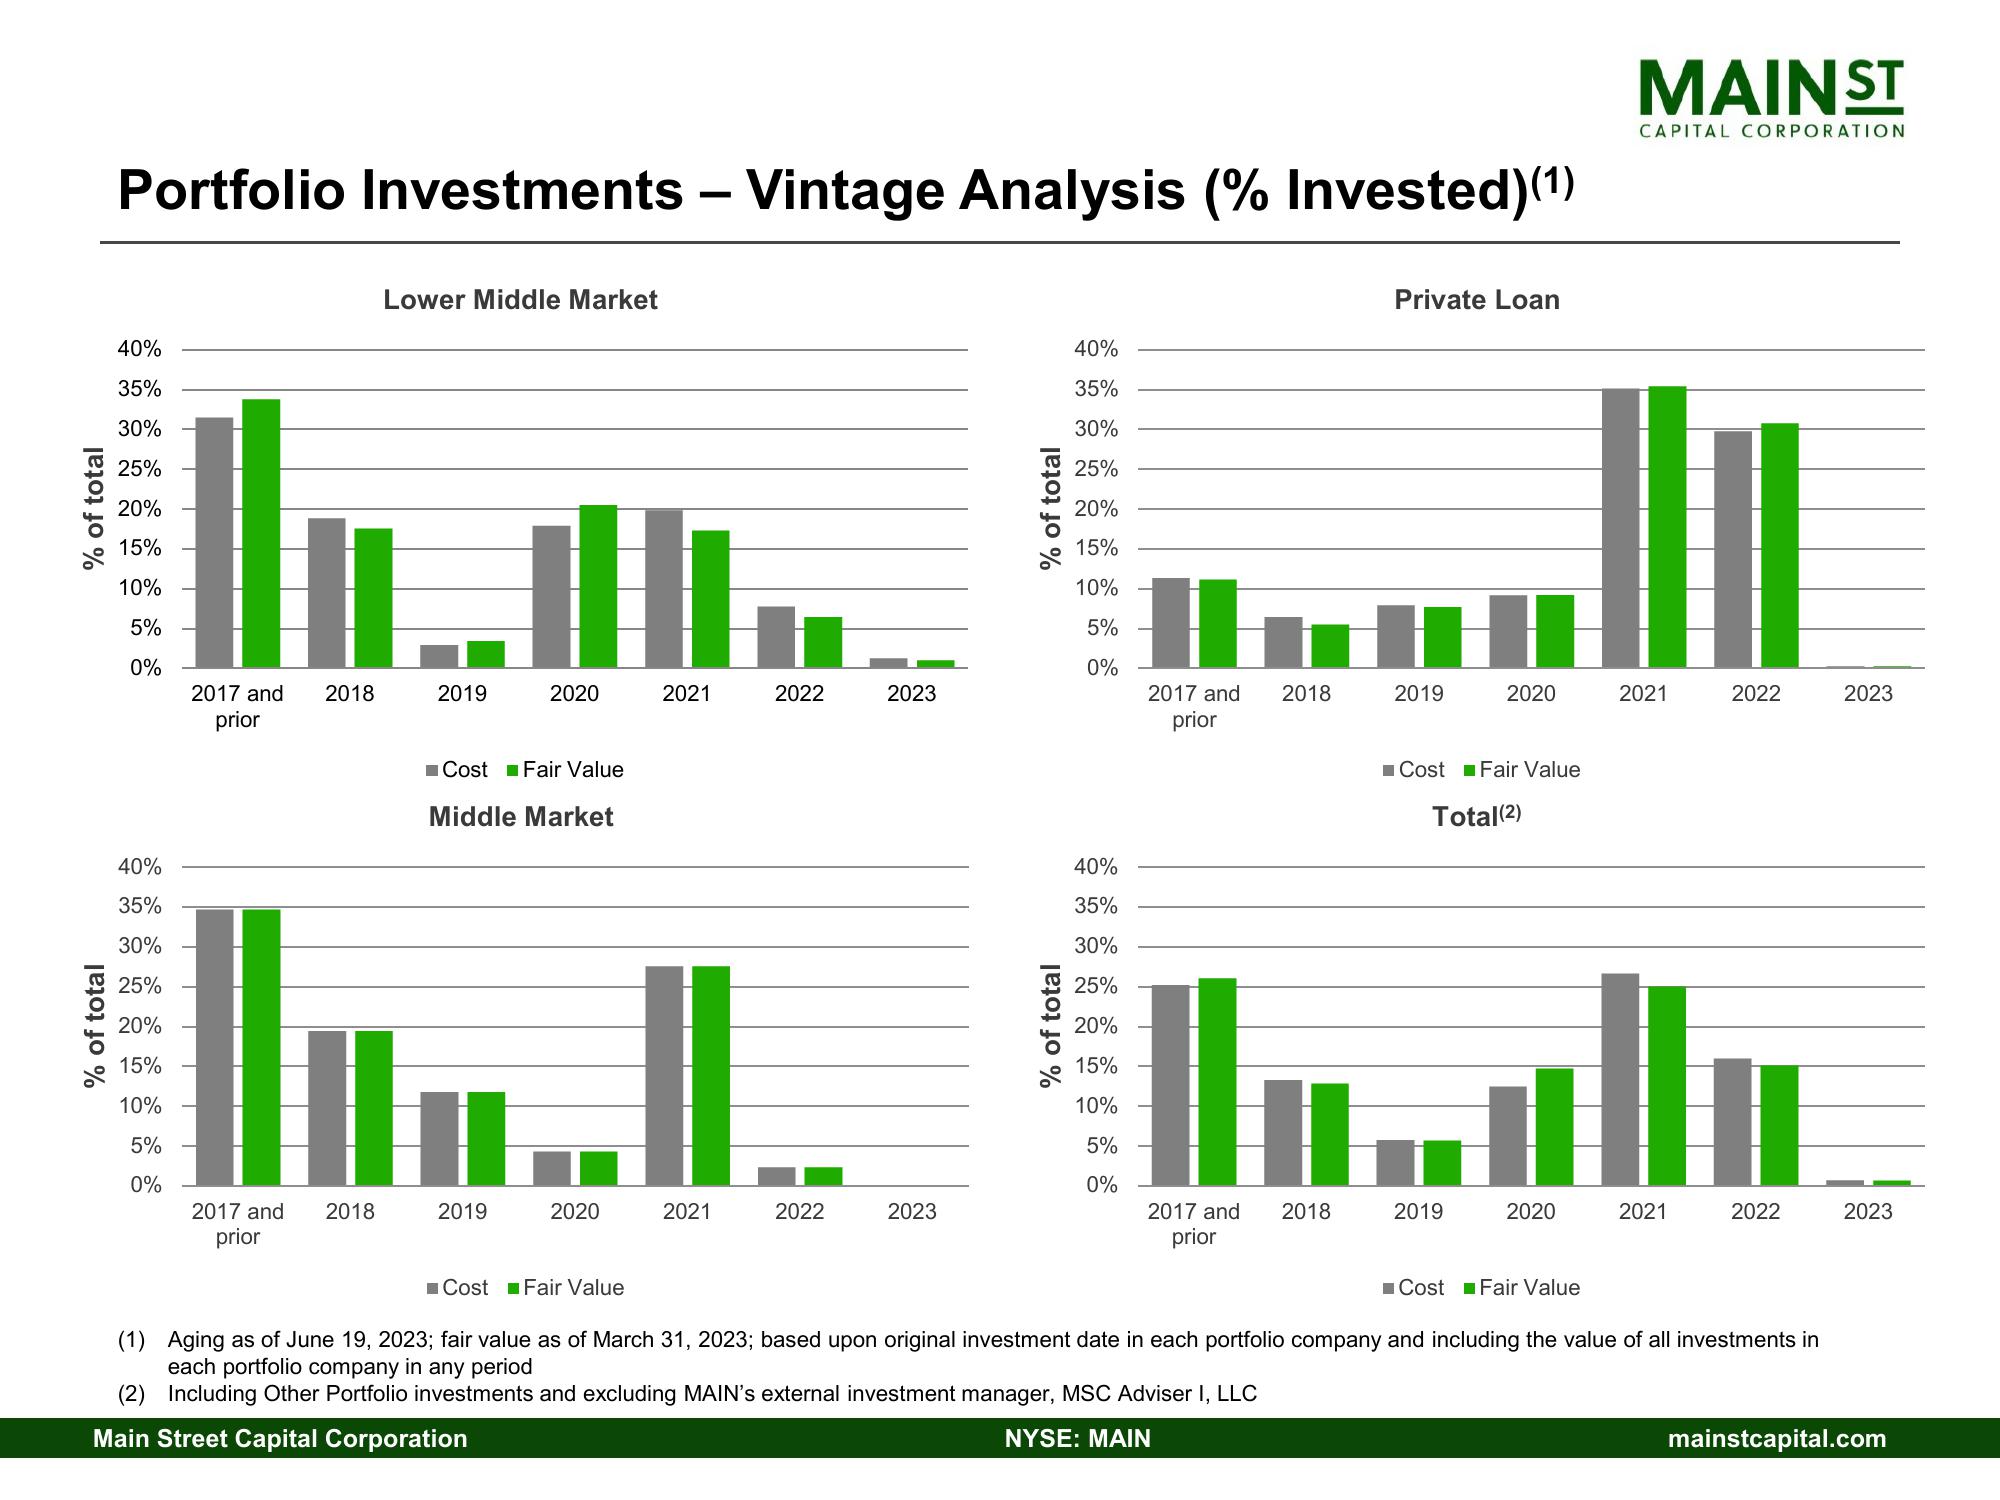
Portfolio Investments - Vintage Analysis (% Invested)(1)
40%
35%
30%
25%
20%
15%
10%
5%
0%
40%
35%
30%
25%
20%
15%
10%
5%
0%
2017 and
prior
2017 and
prior
2018
2018
Lower Middle Market
2019
2020
Cost Fair Value
Middle Market
2019
2020
Cost Fair Value
2021
2021
2022
2022
2023
2023
% of total
40%
35%
30%
25%
20%
15%
10%
5%
0%
40%
35%
30%
25%
20%
15%
10%
5%
0%
2017 and
prior
2017 and
prior
2018
2018
Private Loan
2019
2020
Cost Fair Value
Total(2)
2019
2020
MAINST
J
Cost Fair Value
CAPITAL CORPORATION
2021
2021
2022
2022
(1) Aging as of June 19, 2023; fair value as of March 31, 2023; based upon original investment date in each portfolio company and including the value of all investments in
each portfolio company in any period
(2) Including Other Portfolio investments and excluding MAIN's external investment manager, MSC Adviser I, LLC
Main Street Capital Corporation
NYSE: MAIN
2023
2023
mainstcapital.comView entire presentation