Zegna Results Presentation Deck
FY 2021 preliminary Group Revenues by Geography
Growth led by United States and Greater China Region
●
●
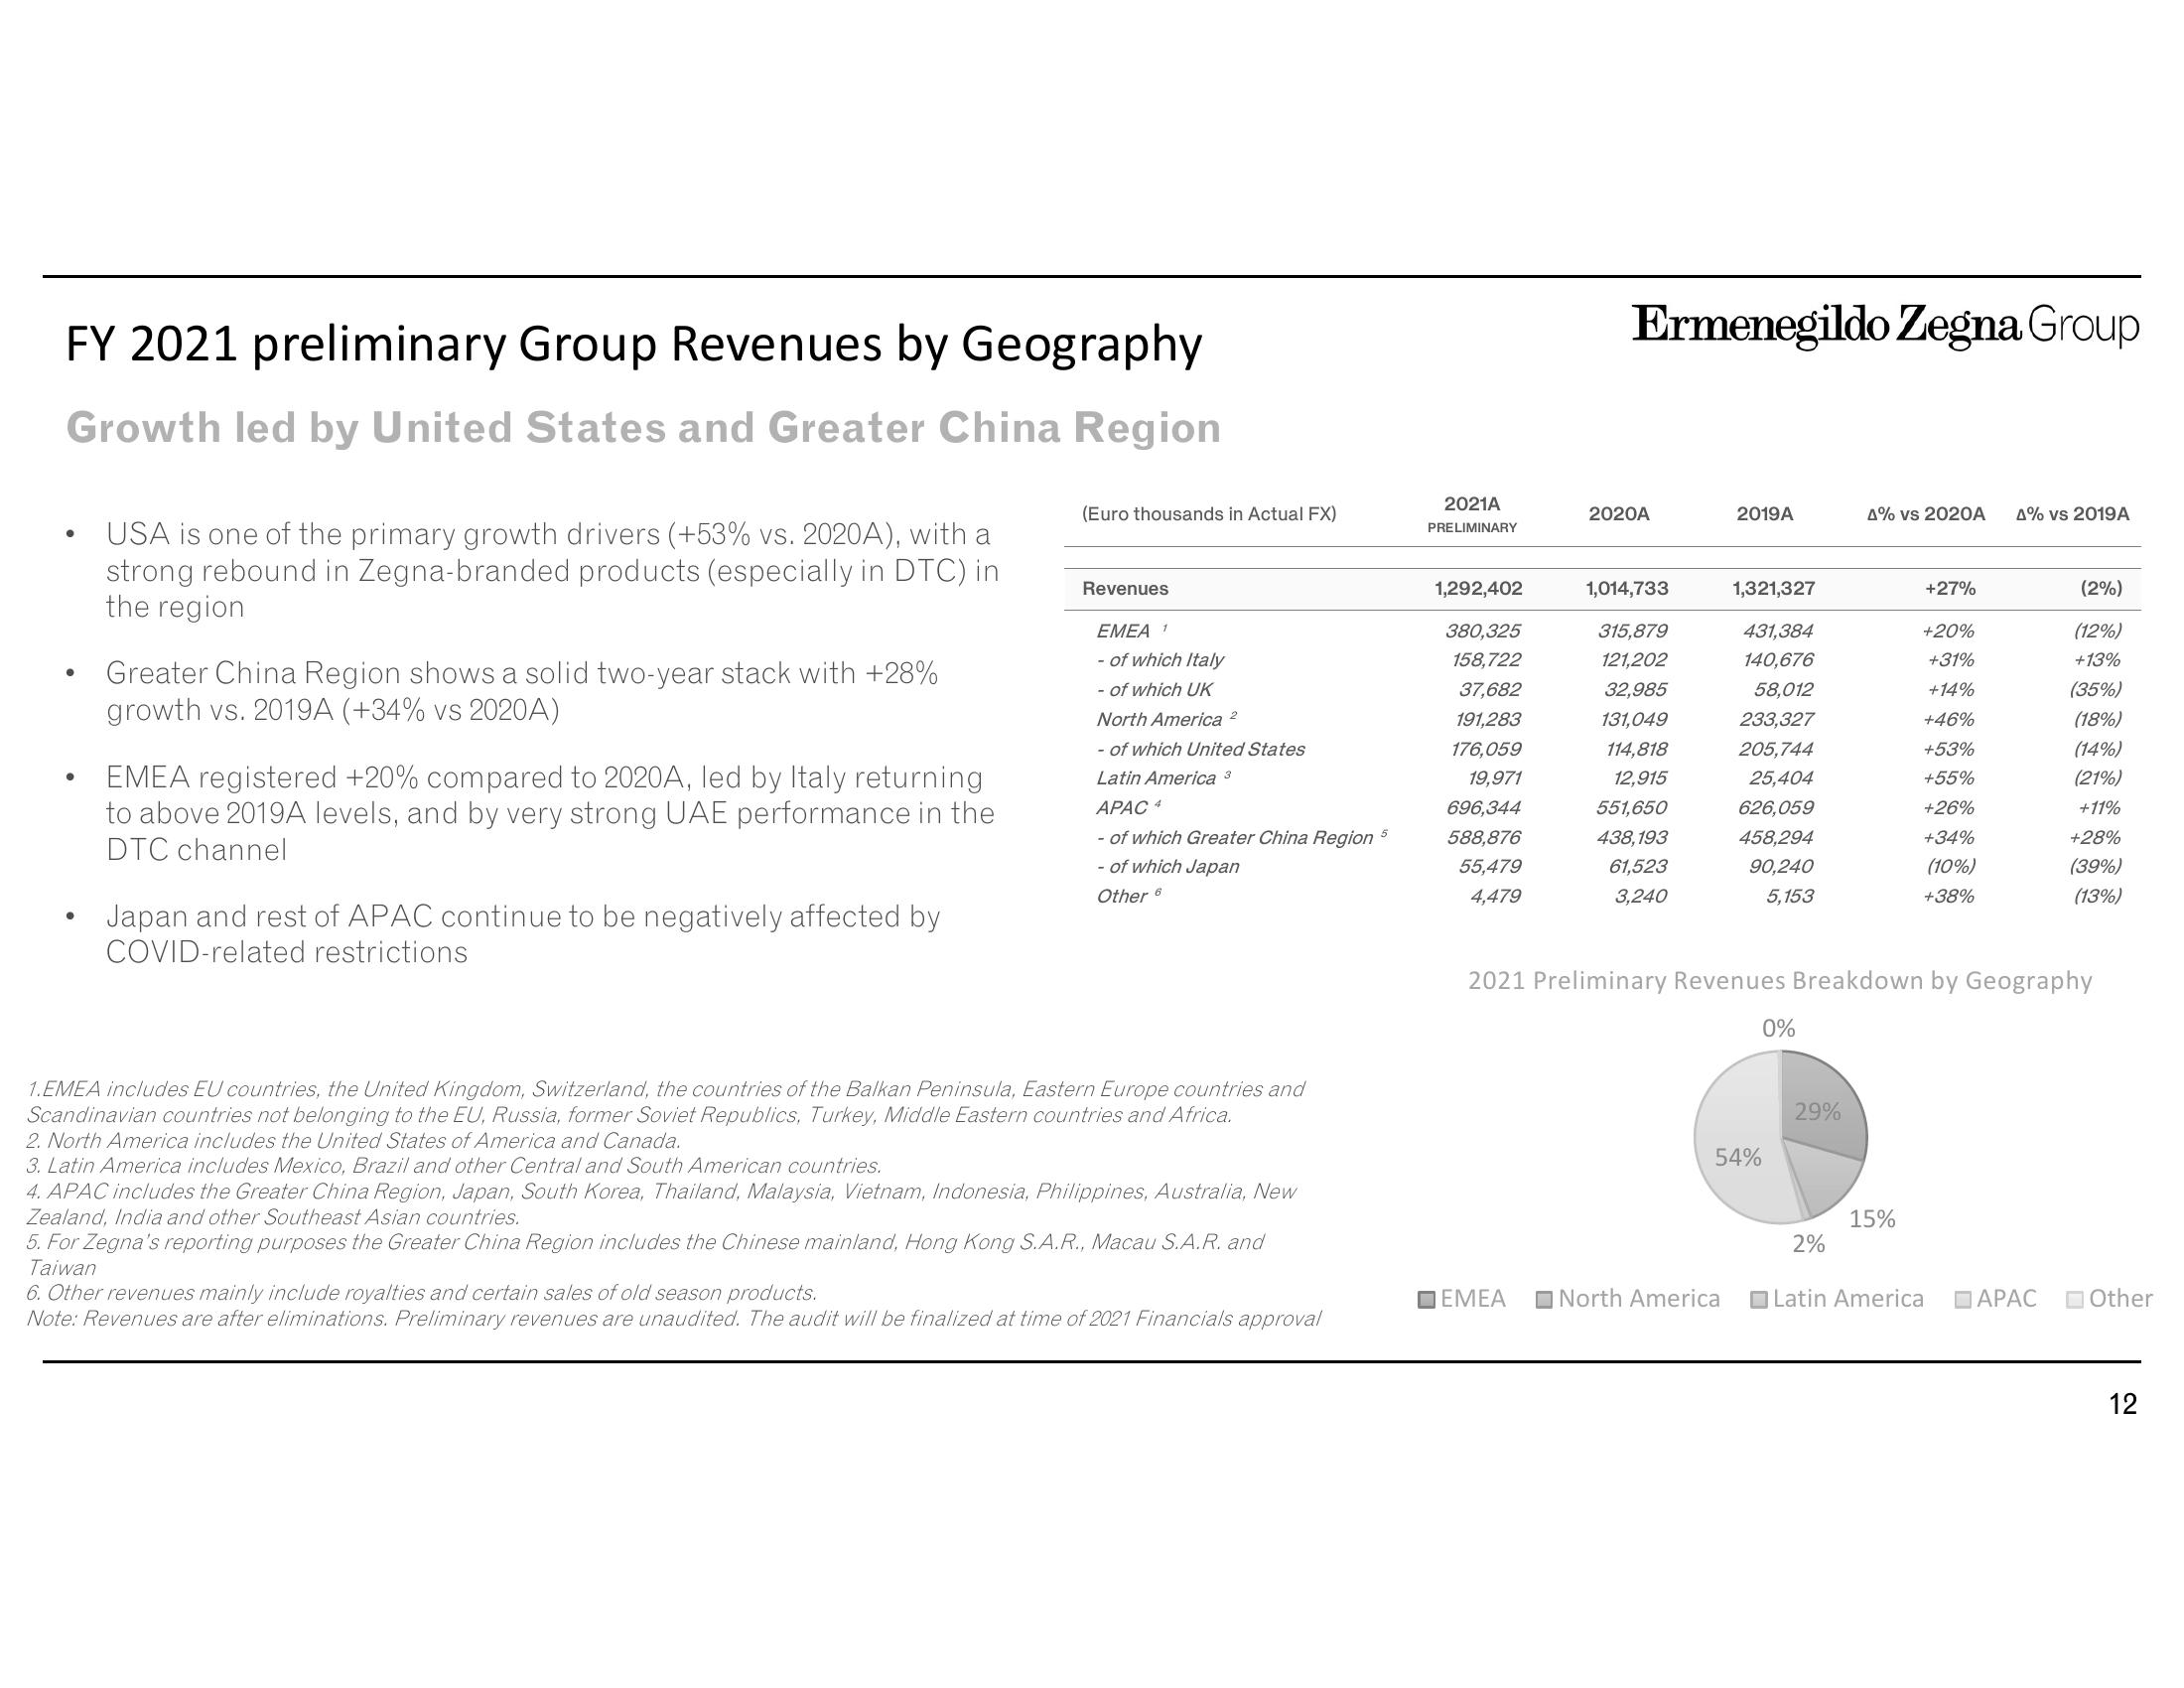
USA is one of the primary growth drivers (+53% vs. 2020A), with a
strong rebound in Zegna-branded products (especially in DTC) in
the region
Greater China Region shows a solid two-year stack with +28%
growth vs. 2019A (+34% vs 2020A)
EMEA registered +20% compared to 2020A, led by Italy returning
to above 2019A levels, and by very strong UAE performance in the
DTC channel
Japan and rest of APAC continue to be negatively affected by
COVID-related restrictions
(Euro thousands in Actual FX)
Revenues
EMEA 1
- of which Italy
- of which UK
North America 2
- of which United States
Latin America 3
APAC 4
- of which Greater China Region 5
- of which Japan
Other 6
1.EMEA includes EU countries, the United Kingdom, Switzerland, the countries of the Balkan Peninsula, Eastern Europe countries and
Scandinavian countries not belonging to the EU, Russia, former Soviet Republics, Turkey, Middle Eastern countries and Africa.
2. North America includes the United States of America and Canada.
3. Latin America includes Mexico, Brazil and other Central and South American countries.
4. APAC includes the Greater China Region, Japan, South Korea, Thailand, Malaysia, Vietnam, Indonesia, Philippines, Australia, New
Zealand, India and other Southeast Asian countries.
5. For Zegna's reporting purposes the Greater China Region includes the Chinese mainland, Hong Kong S.A.R., Macau S.A.R. and
Taiwan
6. Other revenues mainly include royalties and certain sales of old season products.
Note: Revenues are after eliminations. Preliminary revenues are unaudited. The audit will be finalized at time of 2021 Financials approval
2021A
PRELIMINARY
1,292,402
380,325
158,722
37,682
191,283
176,059
19,971
696,344
588,876
55,479
4,479
Ermenegildo Zegna Group
ΠΕΜΕΑ
2020A
1,014,733
315,879
121,202
32,985
131,049
114,818
12,915
551,650
438,193
61,523
3,240
2019A
1,321,327
431,384
140,676
58,012
233,327
205,744
25,404
626,059
458,294
90,240
5,153
North America
54%
0%
2021 Preliminary Revenues Breakdown by Geography
29%
4% vs 2020A A% vs 2019A
2%
15%
+27%
+20%
+31%
+14%
+46%
+53%
+55%
+26%
+34%
(10%)
+38%
Latin America
(2%)
(12%)
+13%
(35%)
(18%)
(14%)
(21%)
+11%
+28%
(39%)
(13%)
APAC Other
12View entire presentation