Blend Results Presentation Deck
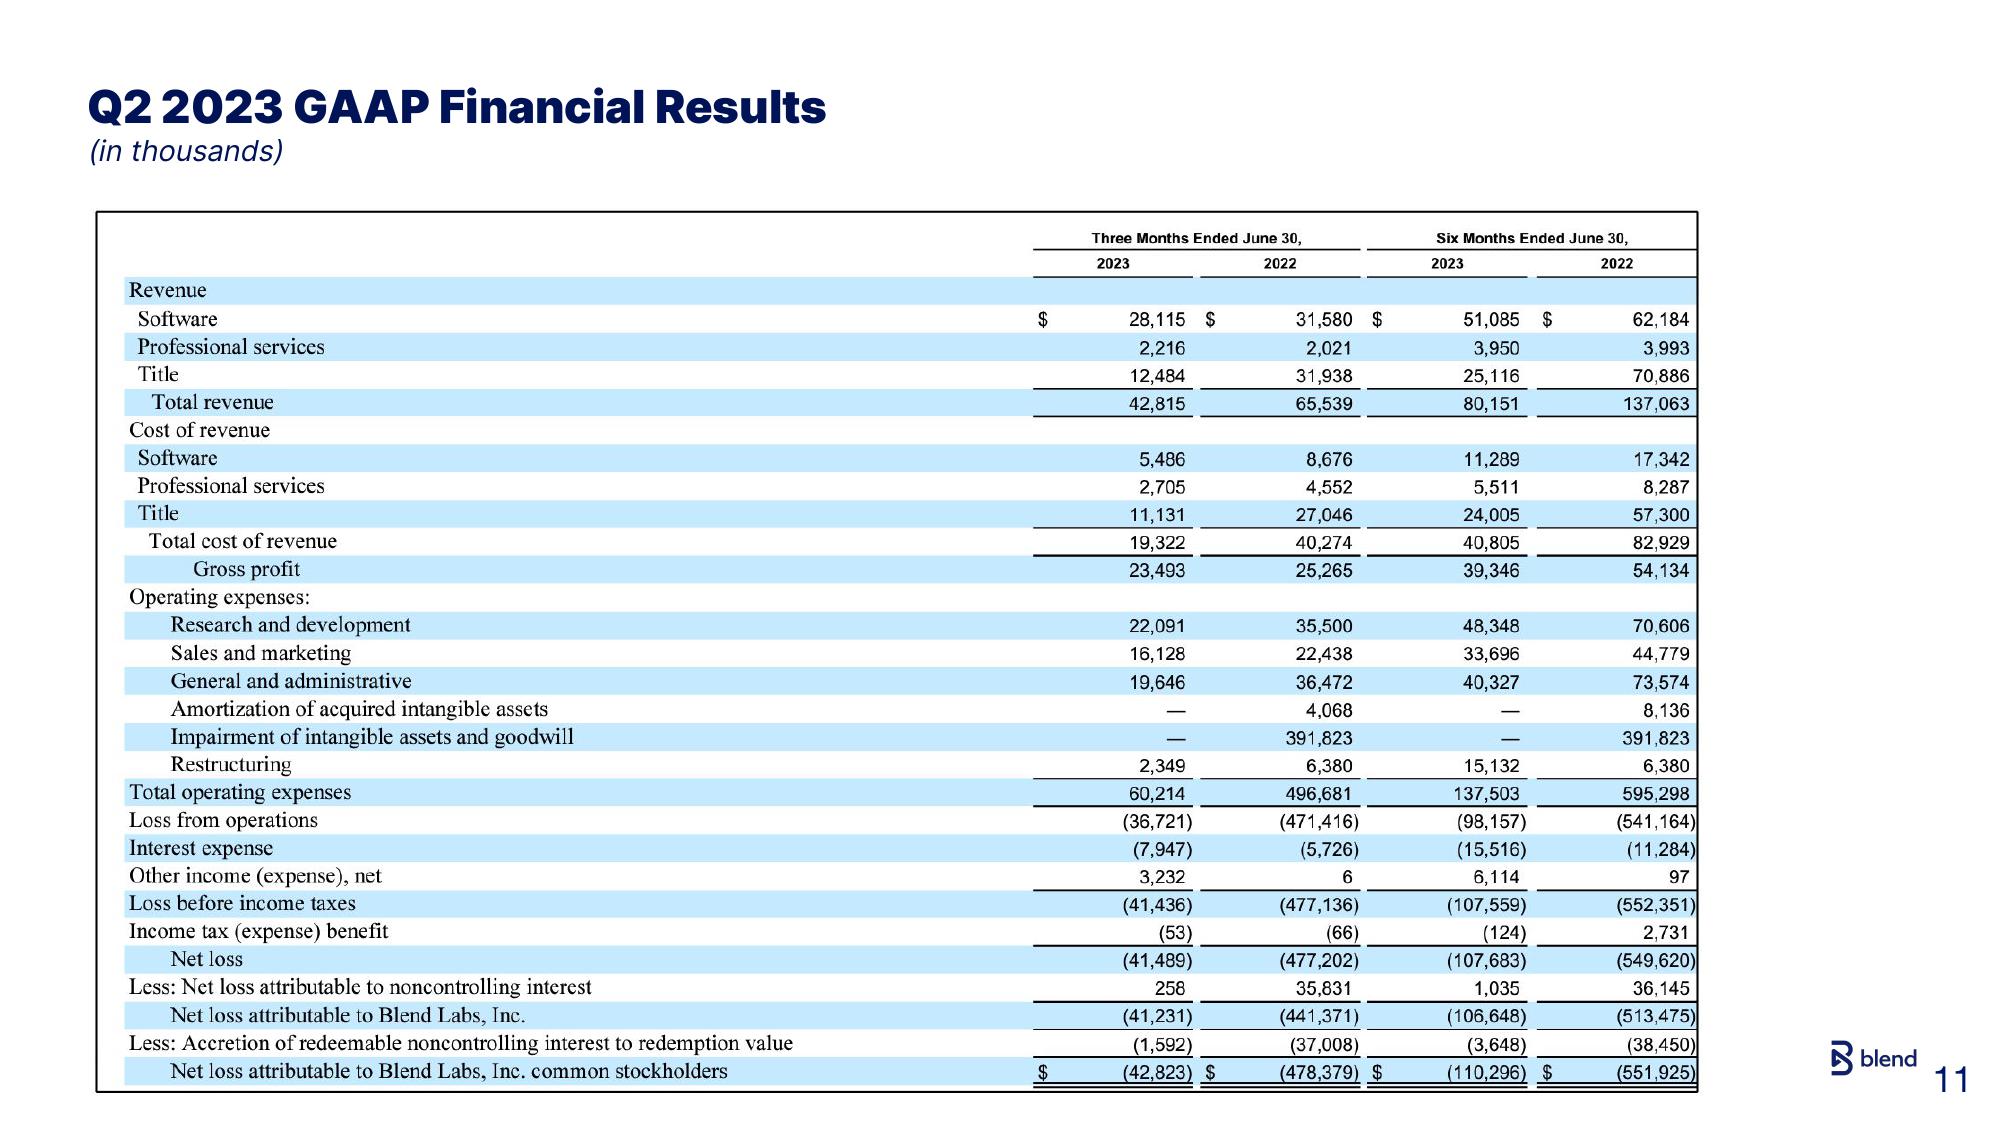
Q2 2023 GAAP Financial Results
(in thousands)
Revenue
Software
Professional services
Title
Total revenue
Cost of revenue
Software
Professional services
Title
Total cost of revenue
Gross profit
Operating expenses:
Research and development
Sales and marketing
General and administrative
Amortization of acquired intangible assets
Impairment of intangible assets and goodwill
Restructuring
Total operating expenses
Loss from operations
Interest expense
Other income (expense), net
Loss before income taxes
Income tax (expense) benefit
Net loss
Less: Net loss attributable to noncontrolling interest
Net loss attributable to Blend Labs, Inc.
Less: Accretion of redeemable noncontrolling interest to redemption value
Net loss attributable to Blend Labs, Inc. common stockholders
$
$
Three Months Ended June 30,
2023
2022
28,115 $
2,216
12,484
42,815
5,486
2,705
11,131
19,322
23,493
22,091
16,128
19,646
2,349
60,214
(36,721)
(7,947)
3,232
(41,436)
(53)
(41,489)
258
(41,231)
(1,592)
(42,823) $
31,580 $
2,021
31,938
65,539
8,676
4,552
27,046
40,274
25,265
35,500
22,438
36,472
4,068
391,823
6,380
496,681
(471,416)
(5,726)
6
(477,136)
(66)
(477,202)
35,831
(441,371)
(37,008)
(478,379) $
Six Months Ended June 30,
2023
2022
51,085 $
3,950
25,116
80,151
11,289
5,511
24,005
40,805
39,346
48,348
33,696
40,327
15, 132
137,503
(98,157)
(15,516)
6,114
(107,559)
(124)
(107,683)
1,035
(106,648)
(3,648)
(110,296) $
62,184
3,993
70,886
137,063
17,342
8,287
57,300
82,929
54,134
70,606
44,779
73,574
8,136
391,823
6,380
595,298
(541,164)
(11,284)
97
(552,351)
2,731
(549,620)
36,145
(513,475)
(38,450)
(551,925)
blend
11View entire presentation