HashiCorp Investor Day Presentation Deck
43
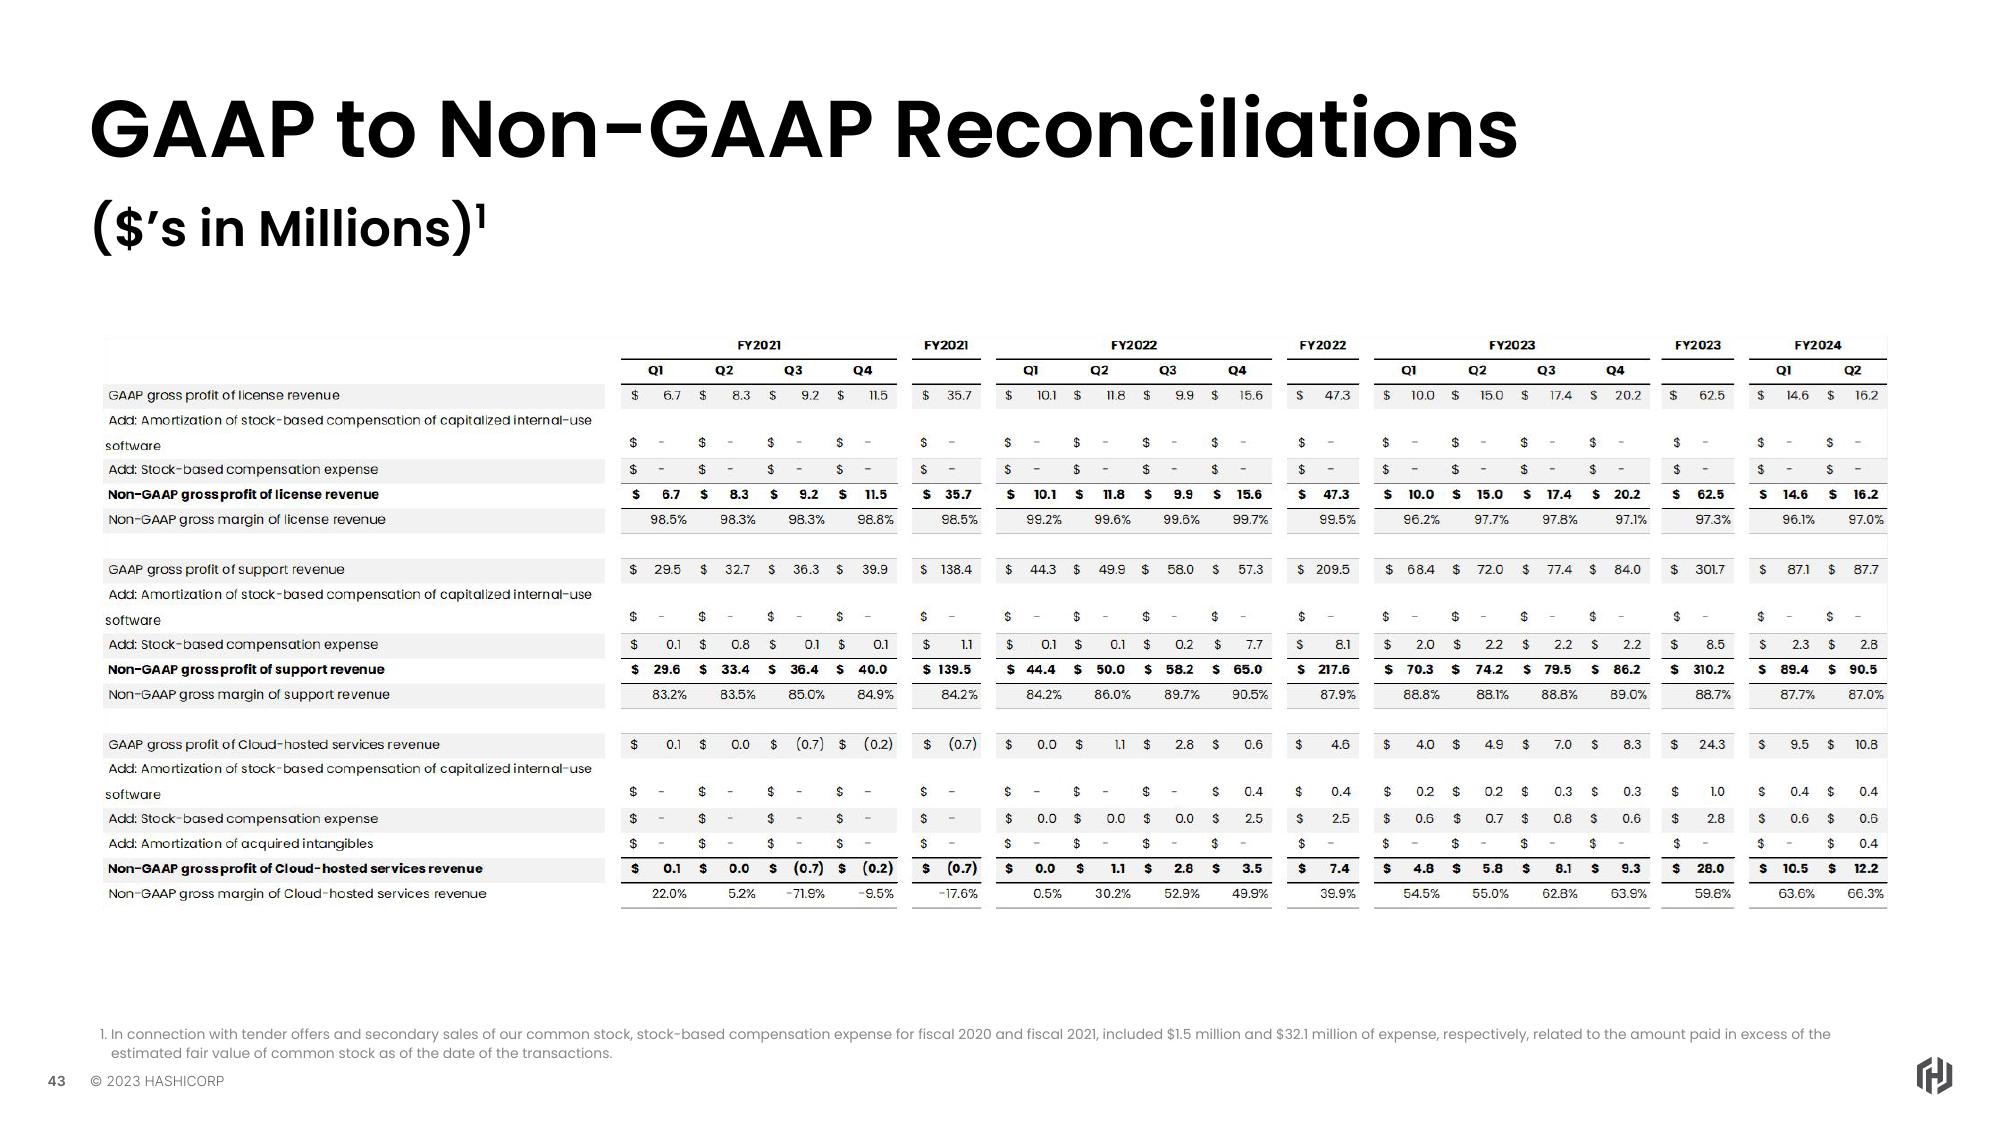
GAAP to Non-GAAP Reconciliations
($'s in Millions)¹
GAAP gross profit of license revenue.
Add: Amortization of stock-based compensation of capitalized internal-use
software
Add: Stock-based compensation expense
Non-GAAP gross profit of license revenue
Non-GAAP gross margin of license revenue
GAAP gross profit of support revenue
Add: Amortization of stock-based compensation of capitalized internal-use
software
Add: Stock-based compensation expense
Non-GAAP gross profit of support revenue
Non-GAAP gross margin of support revenue
GAAP gross profit of Cloud-hosted services revenue
Add: Amortization of stock-based compensation of capitalized internal-use
software
Add: Stock-based compensation expense
Add: Amortization of acquired intangibles
Non-GAAP gross profit of Cloud-hosted services revenue
Non-GAAP gross margin of Cloud-hosted services revenue
$
$
$
$
$
Q1
$
6.7 $
6.7
98.5%
$
$
0.1
$
29.5 $
$
$
0.1
$
$ 29.6 $
83.2%
$
$
$
$
$
$
$
$ 0.1 $
22.0%
$
02
8.3
-
-
8.3
FY2021
98.3%
32.7
-
0.8
33.4
83.5%
0.0
-
-
0.0
5.2%
$
$
$
$
$ 9.2
98.3%
$
Q3
9.2
$
$
$
36.3
-
$
$
$
$
$ 11.5
98.8%
$
S 36.4 $
85.0%
Q4
11.5
$
0.1 $ 0.1
40.0
84.9%
$
39.9
$ (0.7) $ (0.2)
$
$
(0.7) $ (0.2)
-71.9%
-9.5%
FY2021
35.7
$
$
$ 35.7
98.5%
$ 138.4
$
$ 1.1
$ 139.5
$
84.2%
$ (0.7)
$
$
$ (0.7)
-17.6%
$ 10.1 $
$
$
$
$
Q1
$ 44.3
$
$
-
$
$
10.1
99.2%
$ -
$ 0.1 $
$ 44.4 $
84.2%
0.0
$
0.0
0.5%
$
02
$
FY2022
$
$
$
$ 11.8 $ 9.9
99.6%
99.6%
11.8 $
49.9 $
0.1
50.0
86.0%
$
1.1 $
0.0
03
9.9
$
58.0
-
$
$
0.0
$
$
$ 15.6
99.7%
$
2.8 $
Q4
$
0.2
$
7.7
$ 58.2 S 65.0
89.7%
90.5%
15.6
$
57.3
$
0.0 $
$
$
$
$
$
$ 1.1 $ 2.8 $ 3.5
30.2% 52.9%
49.9%
-
0.6
0.4
2.5
FY2022
$
$
$
$ 47.3
99.5%
47.3
$ 209.5
$
$
8.1
$ 217.6
$
$
$
-
87.9%
4.6
0.4
2.5
$
$ 7.4
39.9%
$ 10.0
$
$ -
$ 10.0
96.2%
Q1
$ 68.4
$
$
$
$
-
4.0
$
$
$ 2.0 $
22
$ 70.3 $ 74.2
88.8%
88.1%
0.2
0.6
$
$
Q2
$
$
$
$
$
$ -
$ 15.0 $ 17.4
97.7%
97.8%
FY2023
15.0 $
$
72.0 $
-
0.2 $
0.7 $
$
$
$ 4.8 $ 5.8 $
54.5%
55.0%
$
03
4.9 $
17,4
77.4
$
$ 79.5
88.8%
-
Q4
S 20.2
$
2.2 $ 2.2
$ 86.2
0.3
$
$
$ 20.2
7.0 $
62,8%
$ 84.0
97.1%
$
89.0%
8.3
0.3
0.6
0.8 $
$
8.1 $ 9.3
63.9%
FY2023
$
$
$
$
$ 301.7
62.5
$
62.5
97.3%
$
8.5
$ 310.2
$
$
88.7%
24.3
1.0
2.8
$
$ 28.0
59.8%
$
$
Q1
S
$
$
$
$ 14.6 $ 16.2
96.1%
97.0%
$
14.6 $ 16.2
-
FY2024
-
$ 87.1 $ 87.7
$
$
$ 2.3 $ 2.8
$ 89.4 $ 90.5
87.7%
87.0%
Q2
-
9.5 $ 10.8
0.4
0.6
$
0.4
S
$
0.6
$
$ 0.4
$ 10.5 $ 12.2
63.6%
66.3%
1. In connection with tender offers and secondary sales of our common stock, stock-based compensation expense for fiscal 2020 and fiscal 2021, included $1.5 million and $32.1 million of expense, respectively, related to the amount paid in excess of the
estimated fair value of common stock as of the date of the transactions.
© 2023 HASHICORP
HView entire presentation